Mongolian vs Sierra Leonean Child Poverty Among Girls Under 16
COMPARE
Mongolian
Sierra Leonean
Child Poverty Among Girls Under 16
Child Poverty Among Girls Under 16 Comparison
Mongolians
Sierra Leoneans
15.4%
CHILD POVERTY AMONG GIRLS UNDER 16
89.7/ 100
METRIC RATING
132nd/ 347
METRIC RANK
17.6%
CHILD POVERTY AMONG GIRLS UNDER 16
8.9/ 100
METRIC RATING
208th/ 347
METRIC RANK
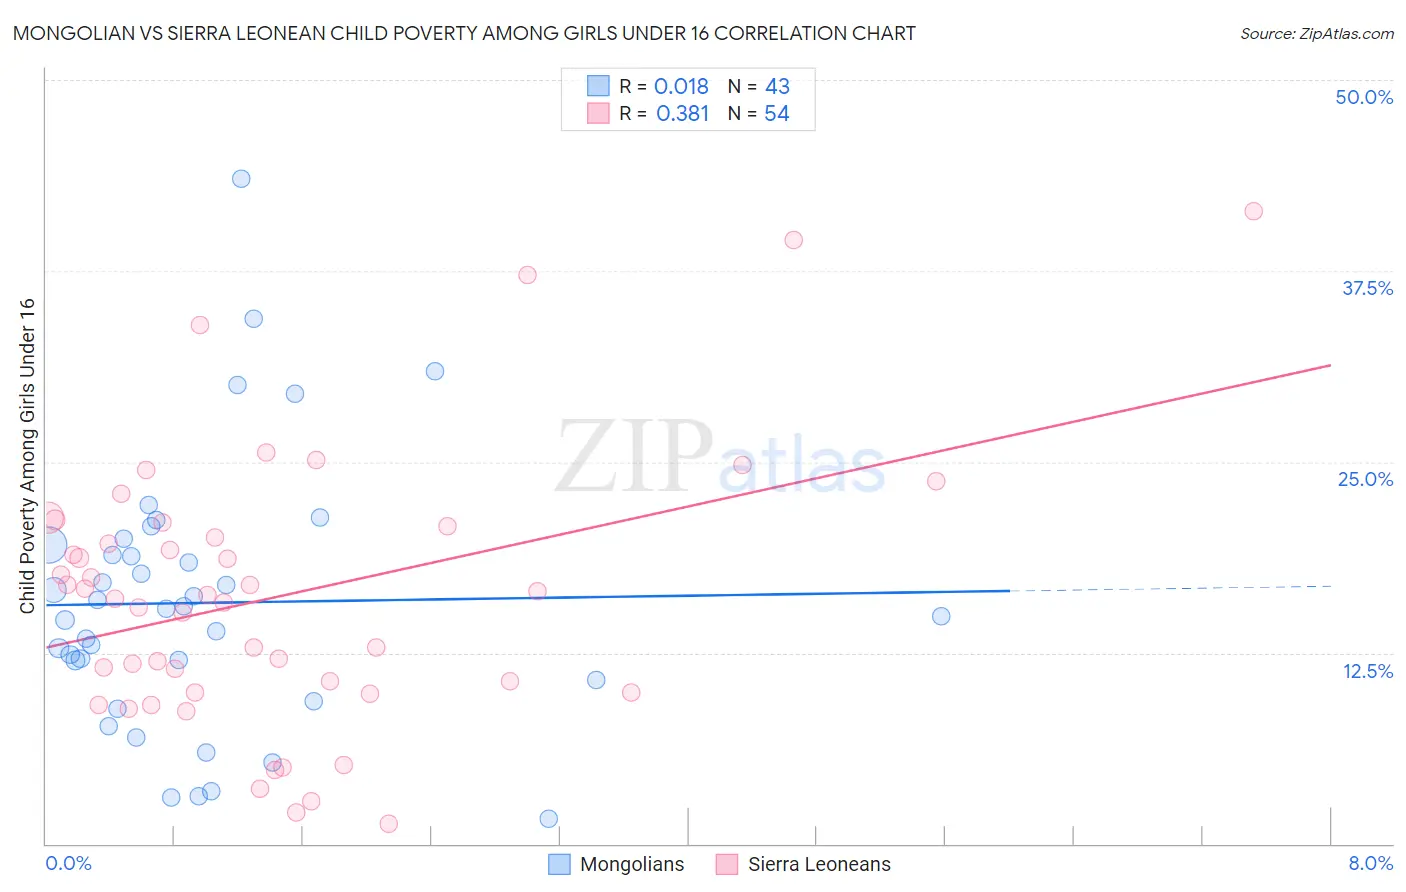
Mongolian vs Sierra Leonean Child Poverty Among Girls Under 16 Correlation Chart
The statistical analysis conducted on geographies consisting of 139,540,451 people shows no correlation between the proportion of Mongolians and poverty level among girls under the age of 16 in the United States with a correlation coefficient (R) of 0.018 and weighted average of 15.4%. Similarly, the statistical analysis conducted on geographies consisting of 83,143,649 people shows a mild positive correlation between the proportion of Sierra Leoneans and poverty level among girls under the age of 16 in the United States with a correlation coefficient (R) of 0.381 and weighted average of 17.6%, a difference of 13.7%.
Child Poverty Among Girls Under 16 Correlation Summary
| Measurement | Mongolian | Sierra Leonean |
| Minimum | 1.6% | 1.3% |
| Maximum | 43.5% | 41.4% |
| Range | 41.9% | 40.1% |
| Mean | 15.8% | 16.2% |
| Median | 15.3% | 16.2% |
| Interquartile 25% (IQ1) | 10.7% | 9.9% |
| Interquartile 75% (IQ3) | 19.6% | 20.7% |
| Interquartile Range (IQR) | 8.9% | 10.8% |
| Standard Deviation (Sample) | 8.7% | 8.9% |
| Standard Deviation (Population) | 8.6% | 8.8% |
Similar Demographics by Child Poverty Among Girls Under 16
Demographics Similar to Mongolians by Child Poverty Among Girls Under 16
In terms of child poverty among girls under 16, the demographic groups most similar to Mongolians are Brazilian (15.4%, a difference of 0.020%), Immigrants from Western Europe (15.4%, a difference of 0.11%), Puget Sound Salish (15.4%, a difference of 0.13%), Immigrants from Spain (15.5%, a difference of 0.17%), and Czechoslovakian (15.5%, a difference of 0.21%).
| Demographics | Rating | Rank | Child Poverty Among Girls Under 16 |
| Peruvians | 91.2 /100 | #125 | Exceptional 15.4% |
| Scottish | 91.0 /100 | #126 | Exceptional 15.4% |
| Immigrants | Norway | 90.8 /100 | #127 | Exceptional 15.4% |
| Albanians | 90.5 /100 | #128 | Exceptional 15.4% |
| Immigrants | South Eastern Asia | 90.5 /100 | #129 | Exceptional 15.4% |
| Puget Sound Salish | 90.1 /100 | #130 | Exceptional 15.4% |
| Immigrants | Western Europe | 90.0 /100 | #131 | Exceptional 15.4% |
| Mongolians | 89.7 /100 | #132 | Excellent 15.4% |
| Brazilians | 89.6 /100 | #133 | Excellent 15.4% |
| Immigrants | Spain | 89.1 /100 | #134 | Excellent 15.5% |
| Czechoslovakians | 89.0 /100 | #135 | Excellent 15.5% |
| Native Hawaiians | 89.0 /100 | #136 | Excellent 15.5% |
| South Africans | 88.7 /100 | #137 | Excellent 15.5% |
| Immigrants | Vietnam | 88.2 /100 | #138 | Excellent 15.5% |
| Armenians | 87.9 /100 | #139 | Excellent 15.5% |
Demographics Similar to Sierra Leoneans by Child Poverty Among Girls Under 16
In terms of child poverty among girls under 16, the demographic groups most similar to Sierra Leoneans are Panamanian (17.6%, a difference of 0.070%), Hmong (17.5%, a difference of 0.53%), Immigrants (17.7%, a difference of 0.58%), Delaware (17.4%, a difference of 0.78%), and Immigrants from Eastern Africa (17.7%, a difference of 0.96%).
| Demographics | Rating | Rank | Child Poverty Among Girls Under 16 |
| Immigrants | Kenya | 17.8 /100 | #201 | Poor 17.2% |
| Immigrants | Sierra Leone | 17.6 /100 | #202 | Poor 17.2% |
| Ugandans | 17.5 /100 | #203 | Poor 17.2% |
| Iraqis | 13.0 /100 | #204 | Poor 17.4% |
| Immigrants | Cameroon | 12.6 /100 | #205 | Poor 17.4% |
| Delaware | 11.5 /100 | #206 | Poor 17.4% |
| Hmong | 10.6 /100 | #207 | Poor 17.5% |
| Sierra Leoneans | 8.9 /100 | #208 | Tragic 17.6% |
| Panamanians | 8.7 /100 | #209 | Tragic 17.6% |
| Immigrants | Immigrants | 7.3 /100 | #210 | Tragic 17.7% |
| Immigrants | Eastern Africa | 6.4 /100 | #211 | Tragic 17.7% |
| Immigrants | Thailand | 6.3 /100 | #212 | Tragic 17.7% |
| Pennsylvania Germans | 5.7 /100 | #213 | Tragic 17.8% |
| Malaysians | 5.7 /100 | #214 | Tragic 17.8% |
| German Russians | 5.7 /100 | #215 | Tragic 17.8% |