U.S. Virgin Islander vs Yugoslavian Child Poverty Among Girls Under 16
COMPARE
U.S. Virgin Islander
Yugoslavian
Child Poverty Among Girls Under 16
Child Poverty Among Girls Under 16 Comparison
U.S. Virgin Islanders
Yugoslavians
22.1%
CHILD POVERTY AMONG GIRLS UNDER 16
0.0/ 100
METRIC RATING
319th/ 347
METRIC RANK
16.2%
CHILD POVERTY AMONG GIRLS UNDER 16
64.4/ 100
METRIC RATING
168th/ 347
METRIC RANK
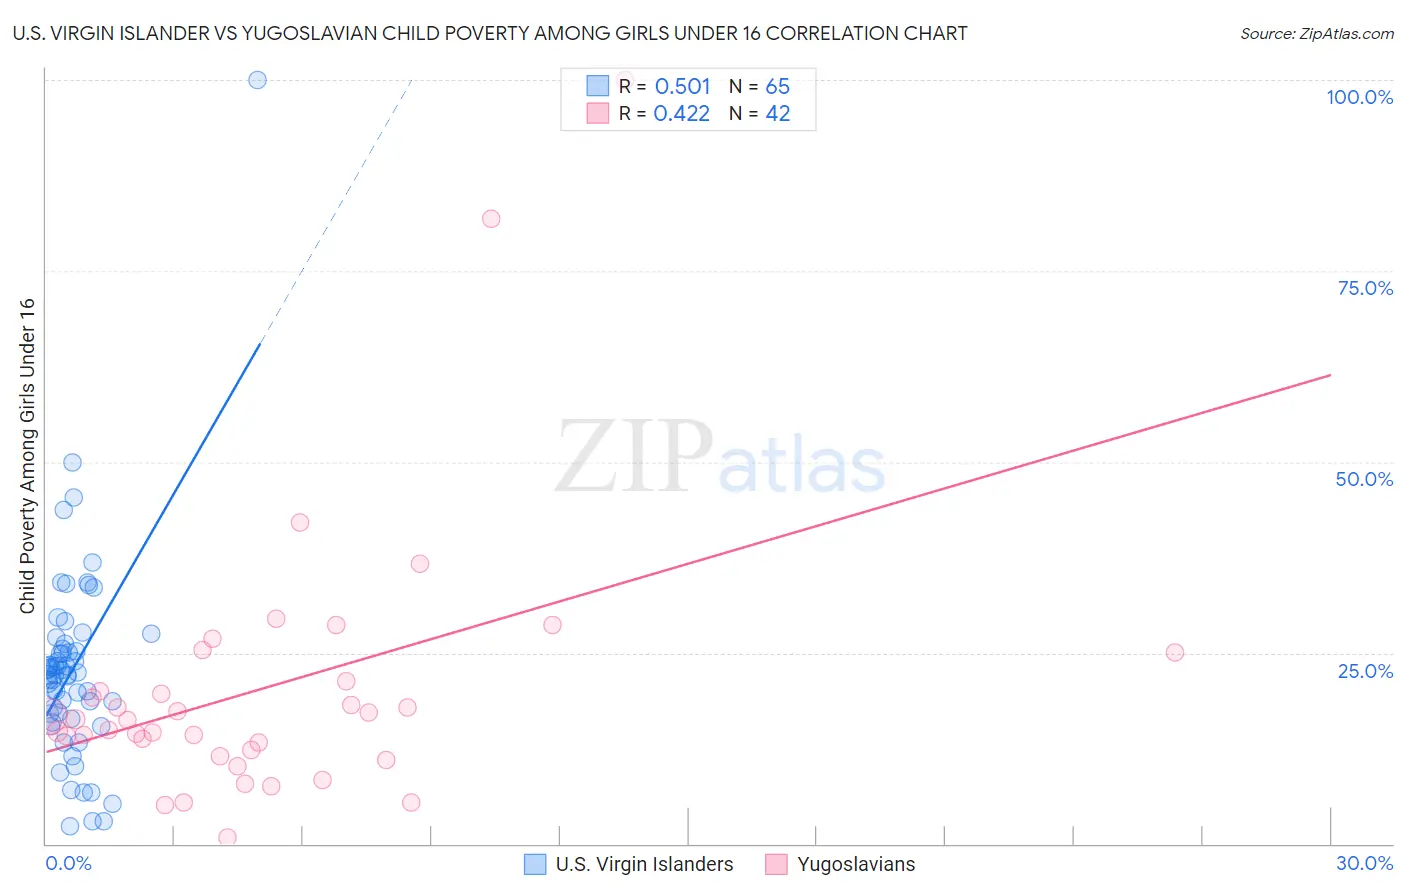
U.S. Virgin Islander vs Yugoslavian Child Poverty Among Girls Under 16 Correlation Chart
The statistical analysis conducted on geographies consisting of 87,265,744 people shows a substantial positive correlation between the proportion of U.S. Virgin Islanders and poverty level among girls under the age of 16 in the United States with a correlation coefficient (R) of 0.501 and weighted average of 22.1%. Similarly, the statistical analysis conducted on geographies consisting of 281,961,993 people shows a moderate positive correlation between the proportion of Yugoslavians and poverty level among girls under the age of 16 in the United States with a correlation coefficient (R) of 0.422 and weighted average of 16.2%, a difference of 36.6%.
Child Poverty Among Girls Under 16 Correlation Summary
| Measurement | U.S. Virgin Islander | Yugoslavian |
| Minimum | 2.3% | 0.83% |
| Maximum | 100.0% | 100.0% |
| Range | 97.7% | 99.2% |
| Mean | 22.9% | 20.4% |
| Median | 22.1% | 16.2% |
| Interquartile 25% (IQ1) | 16.7% | 12.3% |
| Interquartile 75% (IQ3) | 25.9% | 21.3% |
| Interquartile Range (IQR) | 9.2% | 9.1% |
| Standard Deviation (Sample) | 13.7% | 18.1% |
| Standard Deviation (Population) | 13.6% | 17.9% |
Similar Demographics by Child Poverty Among Girls Under 16
Demographics Similar to U.S. Virgin Islanders by Child Poverty Among Girls Under 16
In terms of child poverty among girls under 16, the demographic groups most similar to U.S. Virgin Islanders are Immigrants from Dominica (22.1%, a difference of 0.16%), Honduran (22.2%, a difference of 0.60%), African (21.9%, a difference of 0.82%), Immigrants from Guatemala (21.9%, a difference of 1.1%), and Ute (21.8%, a difference of 1.4%).
| Demographics | Rating | Rank | Child Poverty Among Girls Under 16 |
| Immigrants | Mexico | 0.0 /100 | #312 | Tragic 21.6% |
| Creek | 0.0 /100 | #313 | Tragic 21.7% |
| Arapaho | 0.0 /100 | #314 | Tragic 21.7% |
| Ute | 0.0 /100 | #315 | Tragic 21.8% |
| Immigrants | Guatemala | 0.0 /100 | #316 | Tragic 21.9% |
| Africans | 0.0 /100 | #317 | Tragic 21.9% |
| Immigrants | Dominica | 0.0 /100 | #318 | Tragic 22.1% |
| U.S. Virgin Islanders | 0.0 /100 | #319 | Tragic 22.1% |
| Hondurans | 0.0 /100 | #320 | Tragic 22.2% |
| Colville | 0.0 /100 | #321 | Tragic 22.5% |
| Yakama | 0.0 /100 | #322 | Tragic 22.6% |
| Cajuns | 0.0 /100 | #323 | Tragic 22.6% |
| Paiute | 0.0 /100 | #324 | Tragic 22.6% |
| Immigrants | Congo | 0.0 /100 | #325 | Tragic 22.7% |
| Immigrants | Honduras | 0.0 /100 | #326 | Tragic 22.8% |
Demographics Similar to Yugoslavians by Child Poverty Among Girls Under 16
In terms of child poverty among girls under 16, the demographic groups most similar to Yugoslavians are Costa Rican (16.2%, a difference of 0.010%), Immigrants from Venezuela (16.2%, a difference of 0.020%), Uruguayan (16.2%, a difference of 0.040%), Immigrants from Saudi Arabia (16.2%, a difference of 0.050%), and Afghan (16.2%, a difference of 0.26%).
| Demographics | Rating | Rank | Child Poverty Among Girls Under 16 |
| Immigrants | Northern Africa | 72.0 /100 | #161 | Good 16.0% |
| French Canadians | 68.7 /100 | #162 | Good 16.1% |
| Immigrants | Oceania | 68.4 /100 | #163 | Good 16.1% |
| Immigrants | Colombia | 67.8 /100 | #164 | Good 16.1% |
| Immigrants | Germany | 67.3 /100 | #165 | Good 16.1% |
| South Americans | 67.2 /100 | #166 | Good 16.1% |
| Uruguayans | 64.7 /100 | #167 | Good 16.2% |
| Yugoslavians | 64.4 /100 | #168 | Good 16.2% |
| Costa Ricans | 64.2 /100 | #169 | Good 16.2% |
| Immigrants | Venezuela | 64.2 /100 | #170 | Good 16.2% |
| Immigrants | Saudi Arabia | 64.0 /100 | #171 | Good 16.2% |
| Afghans | 62.3 /100 | #172 | Good 16.2% |
| Immigrants | South America | 55.1 /100 | #173 | Average 16.4% |
| Ethiopians | 50.0 /100 | #174 | Average 16.5% |
| Lebanese | 45.4 /100 | #175 | Average 16.6% |