Immigrants from Ghana vs Sierra Leonean Child Poverty Among Girls Under 16
COMPARE
Immigrants from Ghana
Sierra Leonean
Child Poverty Among Girls Under 16
Child Poverty Among Girls Under 16 Comparison
Immigrants from Ghana
Sierra Leoneans
18.9%
CHILD POVERTY AMONG GIRLS UNDER 16
0.5/ 100
METRIC RATING
247th/ 347
METRIC RANK
17.6%
CHILD POVERTY AMONG GIRLS UNDER 16
8.9/ 100
METRIC RATING
208th/ 347
METRIC RANK
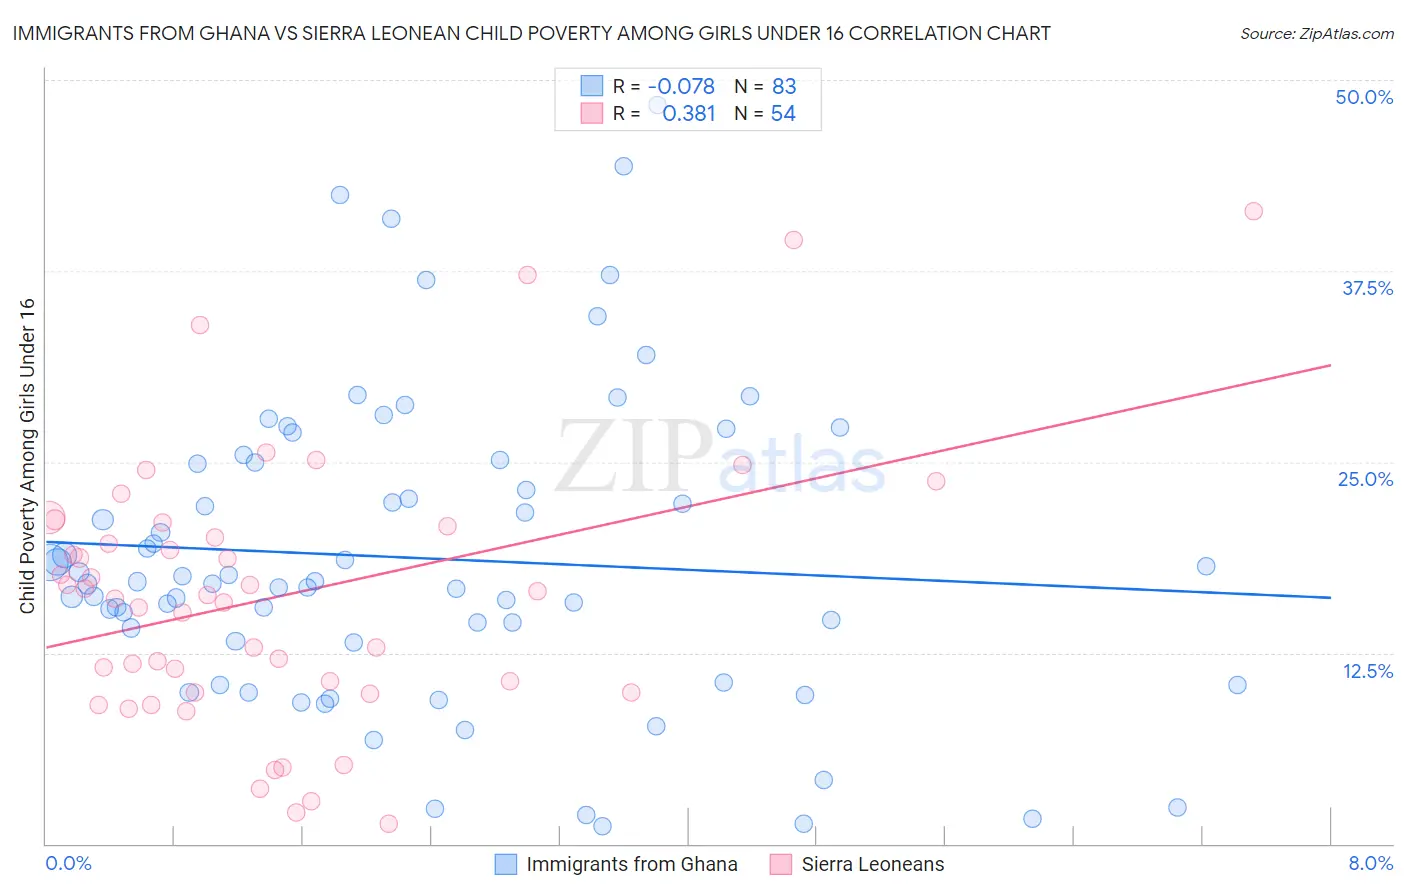
Immigrants from Ghana vs Sierra Leonean Child Poverty Among Girls Under 16 Correlation Chart
The statistical analysis conducted on geographies consisting of 198,244,595 people shows a slight negative correlation between the proportion of Immigrants from Ghana and poverty level among girls under the age of 16 in the United States with a correlation coefficient (R) of -0.078 and weighted average of 18.9%. Similarly, the statistical analysis conducted on geographies consisting of 83,143,649 people shows a mild positive correlation between the proportion of Sierra Leoneans and poverty level among girls under the age of 16 in the United States with a correlation coefficient (R) of 0.381 and weighted average of 17.6%, a difference of 7.8%.
Child Poverty Among Girls Under 16 Correlation Summary
| Measurement | Immigrants from Ghana | Sierra Leonean |
| Minimum | 1.1% | 1.3% |
| Maximum | 48.4% | 41.4% |
| Range | 47.2% | 40.1% |
| Mean | 18.7% | 16.2% |
| Median | 17.2% | 16.2% |
| Interquartile 25% (IQ1) | 13.2% | 9.9% |
| Interquartile 75% (IQ3) | 25.0% | 20.7% |
| Interquartile Range (IQR) | 11.8% | 10.8% |
| Standard Deviation (Sample) | 10.0% | 8.9% |
| Standard Deviation (Population) | 9.9% | 8.8% |
Similar Demographics by Child Poverty Among Girls Under 16
Demographics Similar to Immigrants from Ghana by Child Poverty Among Girls Under 16
In terms of child poverty among girls under 16, the demographic groups most similar to Immigrants from Ghana are Immigrants from Laos (18.9%, a difference of 0.37%), Shoshone (18.9%, a difference of 0.39%), Ecuadorian (18.8%, a difference of 0.51%), Immigrants from Nicaragua (18.8%, a difference of 0.58%), and Immigrants from Cuba (18.8%, a difference of 0.80%).
| Demographics | Rating | Rank | Child Poverty Among Girls Under 16 |
| Nigerians | 0.9 /100 | #240 | Tragic 18.7% |
| Americans | 0.8 /100 | #241 | Tragic 18.8% |
| Immigrants | Cuba | 0.7 /100 | #242 | Tragic 18.8% |
| Immigrants | Nicaragua | 0.7 /100 | #243 | Tragic 18.8% |
| Ecuadorians | 0.7 /100 | #244 | Tragic 18.8% |
| Shoshone | 0.6 /100 | #245 | Tragic 18.9% |
| Immigrants | Laos | 0.6 /100 | #246 | Tragic 18.9% |
| Immigrants | Ghana | 0.5 /100 | #247 | Tragic 18.9% |
| French American Indians | 0.3 /100 | #248 | Tragic 19.2% |
| Potawatomi | 0.3 /100 | #249 | Tragic 19.2% |
| Cape Verdeans | 0.3 /100 | #250 | Tragic 19.2% |
| Immigrants | Trinidad and Tobago | 0.3 /100 | #251 | Tragic 19.2% |
| Immigrants | Middle Africa | 0.3 /100 | #252 | Tragic 19.2% |
| Immigrants | Guyana | 0.3 /100 | #253 | Tragic 19.3% |
| Immigrants | Western Africa | 0.3 /100 | #254 | Tragic 19.3% |
Demographics Similar to Sierra Leoneans by Child Poverty Among Girls Under 16
In terms of child poverty among girls under 16, the demographic groups most similar to Sierra Leoneans are Panamanian (17.6%, a difference of 0.070%), Hmong (17.5%, a difference of 0.53%), Immigrants (17.7%, a difference of 0.58%), Delaware (17.4%, a difference of 0.78%), and Immigrants from Eastern Africa (17.7%, a difference of 0.96%).
| Demographics | Rating | Rank | Child Poverty Among Girls Under 16 |
| Immigrants | Kenya | 17.8 /100 | #201 | Poor 17.2% |
| Immigrants | Sierra Leone | 17.6 /100 | #202 | Poor 17.2% |
| Ugandans | 17.5 /100 | #203 | Poor 17.2% |
| Iraqis | 13.0 /100 | #204 | Poor 17.4% |
| Immigrants | Cameroon | 12.6 /100 | #205 | Poor 17.4% |
| Delaware | 11.5 /100 | #206 | Poor 17.4% |
| Hmong | 10.6 /100 | #207 | Poor 17.5% |
| Sierra Leoneans | 8.9 /100 | #208 | Tragic 17.6% |
| Panamanians | 8.7 /100 | #209 | Tragic 17.6% |
| Immigrants | Immigrants | 7.3 /100 | #210 | Tragic 17.7% |
| Immigrants | Eastern Africa | 6.4 /100 | #211 | Tragic 17.7% |
| Immigrants | Thailand | 6.3 /100 | #212 | Tragic 17.7% |
| Pennsylvania Germans | 5.7 /100 | #213 | Tragic 17.8% |
| Malaysians | 5.7 /100 | #214 | Tragic 17.8% |
| German Russians | 5.7 /100 | #215 | Tragic 17.8% |