Immigrants from Netherlands vs Sierra Leonean Child Poverty Among Girls Under 16
COMPARE
Immigrants from Netherlands
Sierra Leonean
Child Poverty Among Girls Under 16
Child Poverty Among Girls Under 16 Comparison
Immigrants from Netherlands
Sierra Leoneans
14.6%
CHILD POVERTY AMONG GIRLS UNDER 16
98.1/ 100
METRIC RATING
72nd/ 347
METRIC RANK
17.6%
CHILD POVERTY AMONG GIRLS UNDER 16
8.9/ 100
METRIC RATING
208th/ 347
METRIC RANK
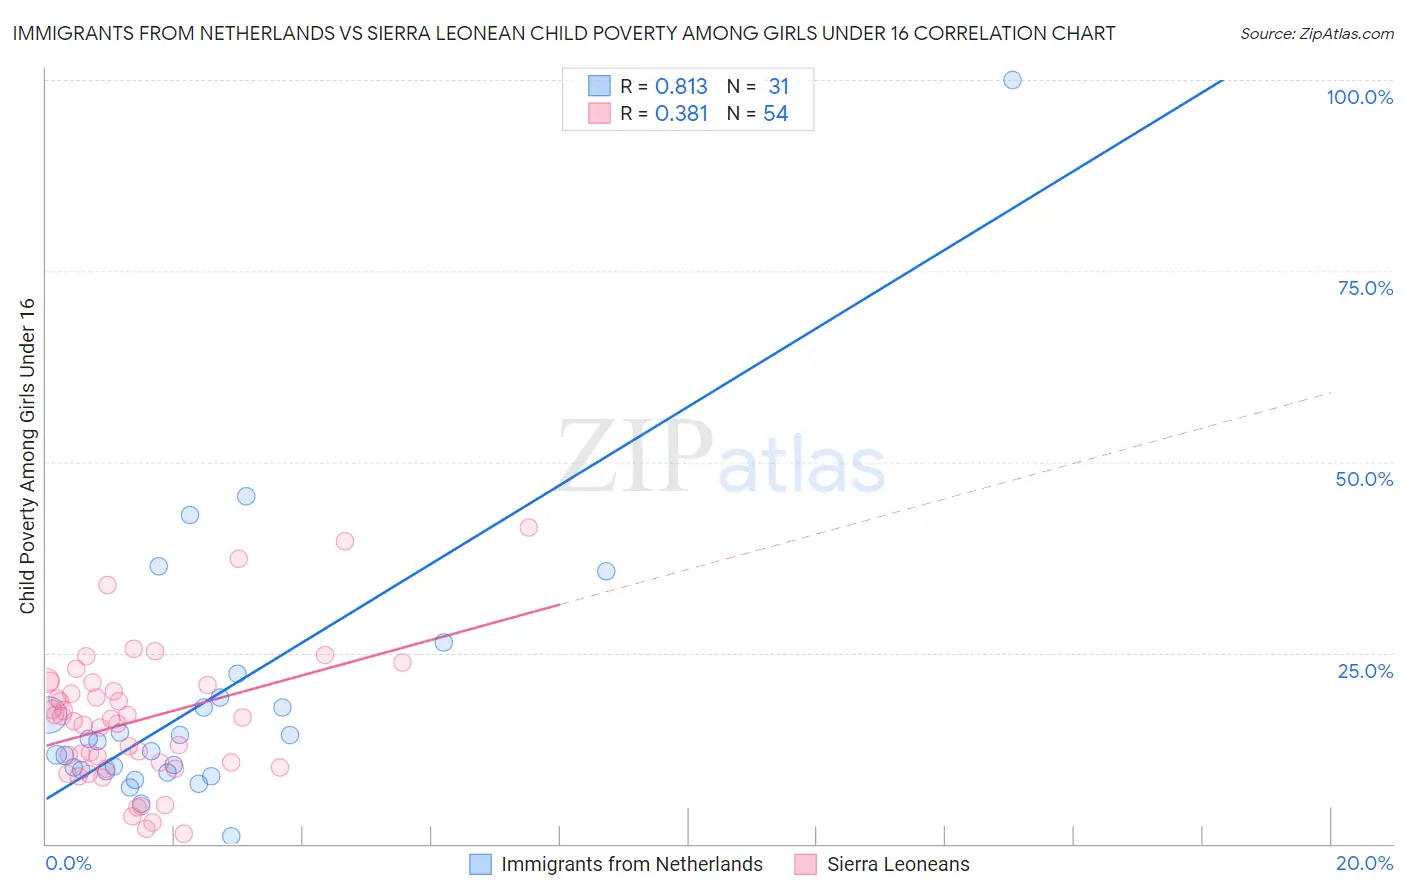
Immigrants from Netherlands vs Sierra Leonean Child Poverty Among Girls Under 16 Correlation Chart
The statistical analysis conducted on geographies consisting of 234,355,214 people shows a very strong positive correlation between the proportion of Immigrants from Netherlands and poverty level among girls under the age of 16 in the United States with a correlation coefficient (R) of 0.813 and weighted average of 14.6%. Similarly, the statistical analysis conducted on geographies consisting of 83,143,649 people shows a mild positive correlation between the proportion of Sierra Leoneans and poverty level among girls under the age of 16 in the United States with a correlation coefficient (R) of 0.381 and weighted average of 17.6%, a difference of 20.3%.
Child Poverty Among Girls Under 16 Correlation Summary
| Measurement | Immigrants from Netherlands | Sierra Leonean |
| Minimum | 1.0% | 1.3% |
| Maximum | 100.0% | 41.4% |
| Range | 99.0% | 40.1% |
| Mean | 18.8% | 16.2% |
| Median | 13.4% | 16.2% |
| Interquartile 25% (IQ1) | 9.5% | 9.9% |
| Interquartile 75% (IQ3) | 19.1% | 20.7% |
| Interquartile Range (IQR) | 9.6% | 10.8% |
| Standard Deviation (Sample) | 18.5% | 8.9% |
| Standard Deviation (Population) | 18.2% | 8.8% |
Similar Demographics by Child Poverty Among Girls Under 16
Demographics Similar to Immigrants from Netherlands by Child Poverty Among Girls Under 16
In terms of child poverty among girls under 16, the demographic groups most similar to Immigrants from Netherlands are Slovene (14.6%, a difference of 0.030%), European (14.6%, a difference of 0.060%), Immigrants from Austria (14.6%, a difference of 0.090%), Taiwanese (14.6%, a difference of 0.12%), and Immigrants from Poland (14.6%, a difference of 0.19%).
| Demographics | Rating | Rank | Child Poverty Among Girls Under 16 |
| Immigrants | Sweden | 98.6 /100 | #65 | Exceptional 14.5% |
| Immigrants | Belgium | 98.5 /100 | #66 | Exceptional 14.5% |
| Laotians | 98.4 /100 | #67 | Exceptional 14.5% |
| Immigrants | Argentina | 98.3 /100 | #68 | Exceptional 14.6% |
| Immigrants | Poland | 98.2 /100 | #69 | Exceptional 14.6% |
| Europeans | 98.1 /100 | #70 | Exceptional 14.6% |
| Slovenes | 98.1 /100 | #71 | Exceptional 14.6% |
| Immigrants | Netherlands | 98.1 /100 | #72 | Exceptional 14.6% |
| Immigrants | Austria | 98.0 /100 | #73 | Exceptional 14.6% |
| Taiwanese | 98.0 /100 | #74 | Exceptional 14.6% |
| Immigrants | Eastern Europe | 98.0 /100 | #75 | Exceptional 14.6% |
| Immigrants | Russia | 97.9 /100 | #76 | Exceptional 14.7% |
| Tlingit-Haida | 97.9 /100 | #77 | Exceptional 14.7% |
| Argentineans | 97.9 /100 | #78 | Exceptional 14.7% |
| Immigrants | Turkey | 97.9 /100 | #79 | Exceptional 14.7% |
Demographics Similar to Sierra Leoneans by Child Poverty Among Girls Under 16
In terms of child poverty among girls under 16, the demographic groups most similar to Sierra Leoneans are Panamanian (17.6%, a difference of 0.070%), Hmong (17.5%, a difference of 0.53%), Immigrants (17.7%, a difference of 0.58%), Delaware (17.4%, a difference of 0.78%), and Immigrants from Eastern Africa (17.7%, a difference of 0.96%).
| Demographics | Rating | Rank | Child Poverty Among Girls Under 16 |
| Immigrants | Kenya | 17.8 /100 | #201 | Poor 17.2% |
| Immigrants | Sierra Leone | 17.6 /100 | #202 | Poor 17.2% |
| Ugandans | 17.5 /100 | #203 | Poor 17.2% |
| Iraqis | 13.0 /100 | #204 | Poor 17.4% |
| Immigrants | Cameroon | 12.6 /100 | #205 | Poor 17.4% |
| Delaware | 11.5 /100 | #206 | Poor 17.4% |
| Hmong | 10.6 /100 | #207 | Poor 17.5% |
| Sierra Leoneans | 8.9 /100 | #208 | Tragic 17.6% |
| Panamanians | 8.7 /100 | #209 | Tragic 17.6% |
| Immigrants | Immigrants | 7.3 /100 | #210 | Tragic 17.7% |
| Immigrants | Eastern Africa | 6.4 /100 | #211 | Tragic 17.7% |
| Immigrants | Thailand | 6.3 /100 | #212 | Tragic 17.7% |
| Pennsylvania Germans | 5.7 /100 | #213 | Tragic 17.8% |
| Malaysians | 5.7 /100 | #214 | Tragic 17.8% |
| German Russians | 5.7 /100 | #215 | Tragic 17.8% |