U.S. Virgin Islander vs Sierra Leonean Cognitive Disability
COMPARE
U.S. Virgin Islander
Sierra Leonean
Cognitive Disability
Cognitive Disability Comparison
U.S. Virgin Islanders
Sierra Leoneans
18.7%
COGNITIVE DISABILITY
0.0/ 100
METRIC RATING
327th/ 347
METRIC RANK
17.9%
COGNITIVE DISABILITY
0.4/ 100
METRIC RATING
262nd/ 347
METRIC RANK
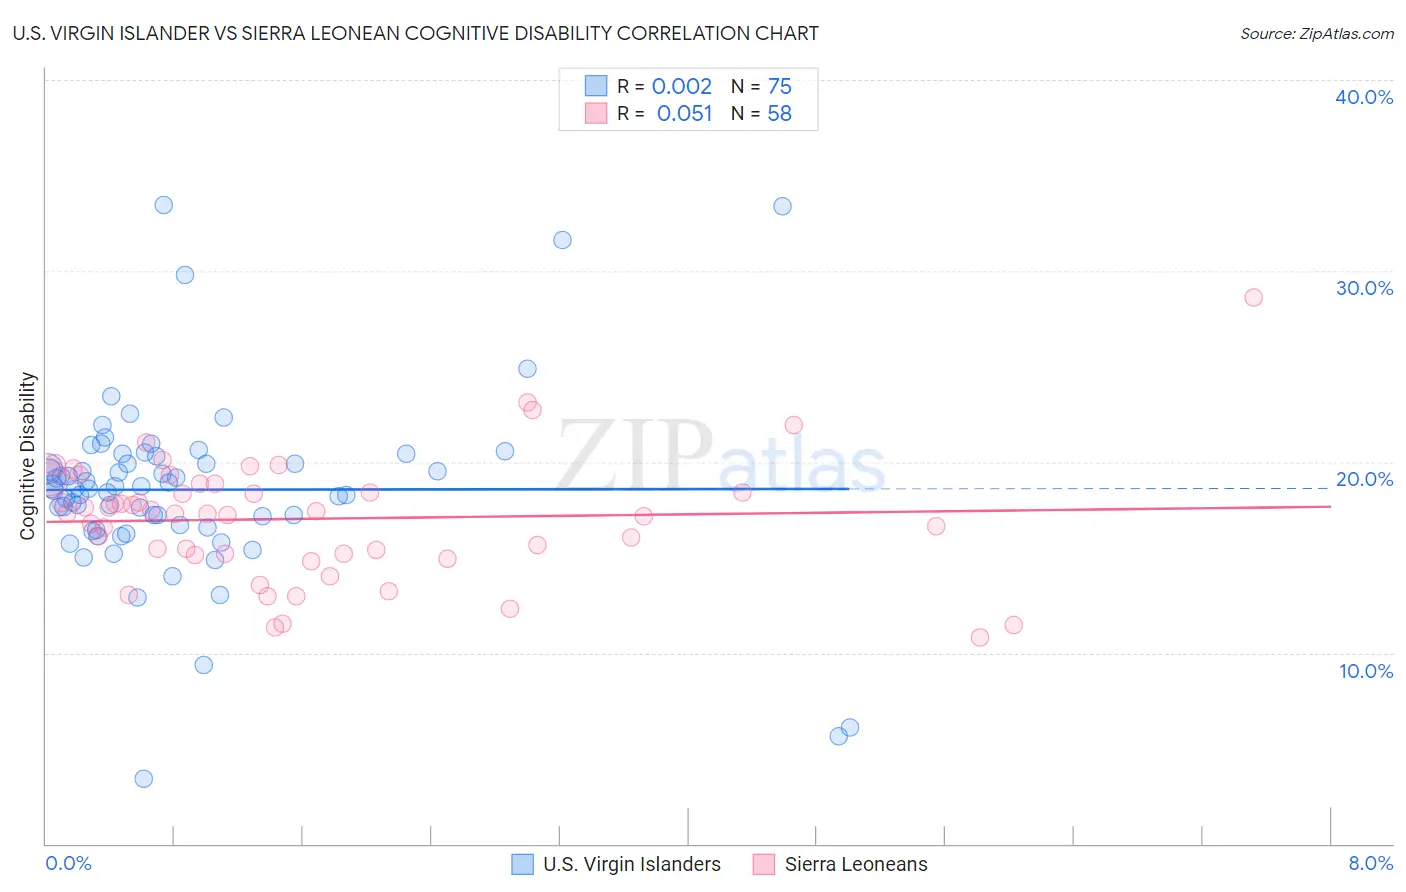
U.S. Virgin Islander vs Sierra Leonean Cognitive Disability Correlation Chart
The statistical analysis conducted on geographies consisting of 87,523,462 people shows no correlation between the proportion of U.S. Virgin Islanders and percentage of population with cognitive disability in the United States with a correlation coefficient (R) of 0.002 and weighted average of 18.7%. Similarly, the statistical analysis conducted on geographies consisting of 83,361,112 people shows a slight positive correlation between the proportion of Sierra Leoneans and percentage of population with cognitive disability in the United States with a correlation coefficient (R) of 0.051 and weighted average of 17.9%, a difference of 4.3%.
Cognitive Disability Correlation Summary
| Measurement | U.S. Virgin Islander | Sierra Leonean |
| Minimum | 3.4% | 10.8% |
| Maximum | 33.5% | 28.6% |
| Range | 30.0% | 17.8% |
| Mean | 18.5% | 17.0% |
| Median | 18.6% | 17.3% |
| Interquartile 25% (IQ1) | 16.6% | 15.2% |
| Interquartile 75% (IQ3) | 20.3% | 18.8% |
| Interquartile Range (IQR) | 3.7% | 3.7% |
| Standard Deviation (Sample) | 4.8% | 3.2% |
| Standard Deviation (Population) | 4.8% | 3.2% |
Similar Demographics by Cognitive Disability
Demographics Similar to U.S. Virgin Islanders by Cognitive Disability
In terms of cognitive disability, the demographic groups most similar to U.S. Virgin Islanders are Immigrants from Senegal (18.7%, a difference of 0.040%), Indonesian (18.7%, a difference of 0.060%), Kiowa (18.7%, a difference of 0.060%), Dominican (18.7%, a difference of 0.14%), and Pueblo (18.7%, a difference of 0.26%).
| Demographics | Rating | Rank | Cognitive Disability |
| Apache | 0.0 /100 | #320 | Tragic 18.6% |
| Africans | 0.0 /100 | #321 | Tragic 18.6% |
| Immigrants | Liberia | 0.0 /100 | #322 | Tragic 18.7% |
| Pueblo | 0.0 /100 | #323 | Tragic 18.7% |
| Dominicans | 0.0 /100 | #324 | Tragic 18.7% |
| Indonesians | 0.0 /100 | #325 | Tragic 18.7% |
| Immigrants | Senegal | 0.0 /100 | #326 | Tragic 18.7% |
| U.S. Virgin Islanders | 0.0 /100 | #327 | Tragic 18.7% |
| Kiowa | 0.0 /100 | #328 | Tragic 18.7% |
| Navajo | 0.0 /100 | #329 | Tragic 18.8% |
| Immigrants | Dominican Republic | 0.0 /100 | #330 | Tragic 18.8% |
| Pima | 0.0 /100 | #331 | Tragic 18.8% |
| Immigrants | Sudan | 0.0 /100 | #332 | Tragic 18.8% |
| Immigrants | Yemen | 0.0 /100 | #333 | Tragic 18.8% |
| Sudanese | 0.0 /100 | #334 | Tragic 18.9% |
Demographics Similar to Sierra Leoneans by Cognitive Disability
In terms of cognitive disability, the demographic groups most similar to Sierra Leoneans are Guamanian/Chamorro (17.9%, a difference of 0.030%), Immigrants from Barbados (17.9%, a difference of 0.040%), Immigrants from Belize (17.9%, a difference of 0.080%), Ethiopian (17.9%, a difference of 0.090%), and Menominee (18.0%, a difference of 0.10%).
| Demographics | Rating | Rank | Cognitive Disability |
| Immigrants | Azores | 0.6 /100 | #255 | Tragic 17.9% |
| Bahamians | 0.6 /100 | #256 | Tragic 17.9% |
| Mexican American Indians | 0.6 /100 | #257 | Tragic 17.9% |
| Immigrants | Armenia | 0.6 /100 | #258 | Tragic 17.9% |
| Ethiopians | 0.5 /100 | #259 | Tragic 17.9% |
| Immigrants | Belize | 0.5 /100 | #260 | Tragic 17.9% |
| Guamanians/Chamorros | 0.5 /100 | #261 | Tragic 17.9% |
| Sierra Leoneans | 0.4 /100 | #262 | Tragic 17.9% |
| Immigrants | Barbados | 0.4 /100 | #263 | Tragic 17.9% |
| Menominee | 0.4 /100 | #264 | Tragic 18.0% |
| Spanish Americans | 0.4 /100 | #265 | Tragic 18.0% |
| Belizeans | 0.4 /100 | #266 | Tragic 18.0% |
| Nepalese | 0.3 /100 | #267 | Tragic 18.0% |
| Cherokee | 0.3 /100 | #268 | Tragic 18.0% |
| Hondurans | 0.3 /100 | #269 | Tragic 18.0% |