U.S. Virgin Islander vs Immigrants from Iraq Child Poverty Among Girls Under 16
COMPARE
U.S. Virgin Islander
Immigrants from Iraq
Child Poverty Among Girls Under 16
Child Poverty Among Girls Under 16 Comparison
U.S. Virgin Islanders
Immigrants from Iraq
22.1%
CHILD POVERTY AMONG GIRLS UNDER 16
0.0/ 100
METRIC RATING
319th/ 347
METRIC RANK
16.6%
CHILD POVERTY AMONG GIRLS UNDER 16
43.2/ 100
METRIC RATING
181st/ 347
METRIC RANK
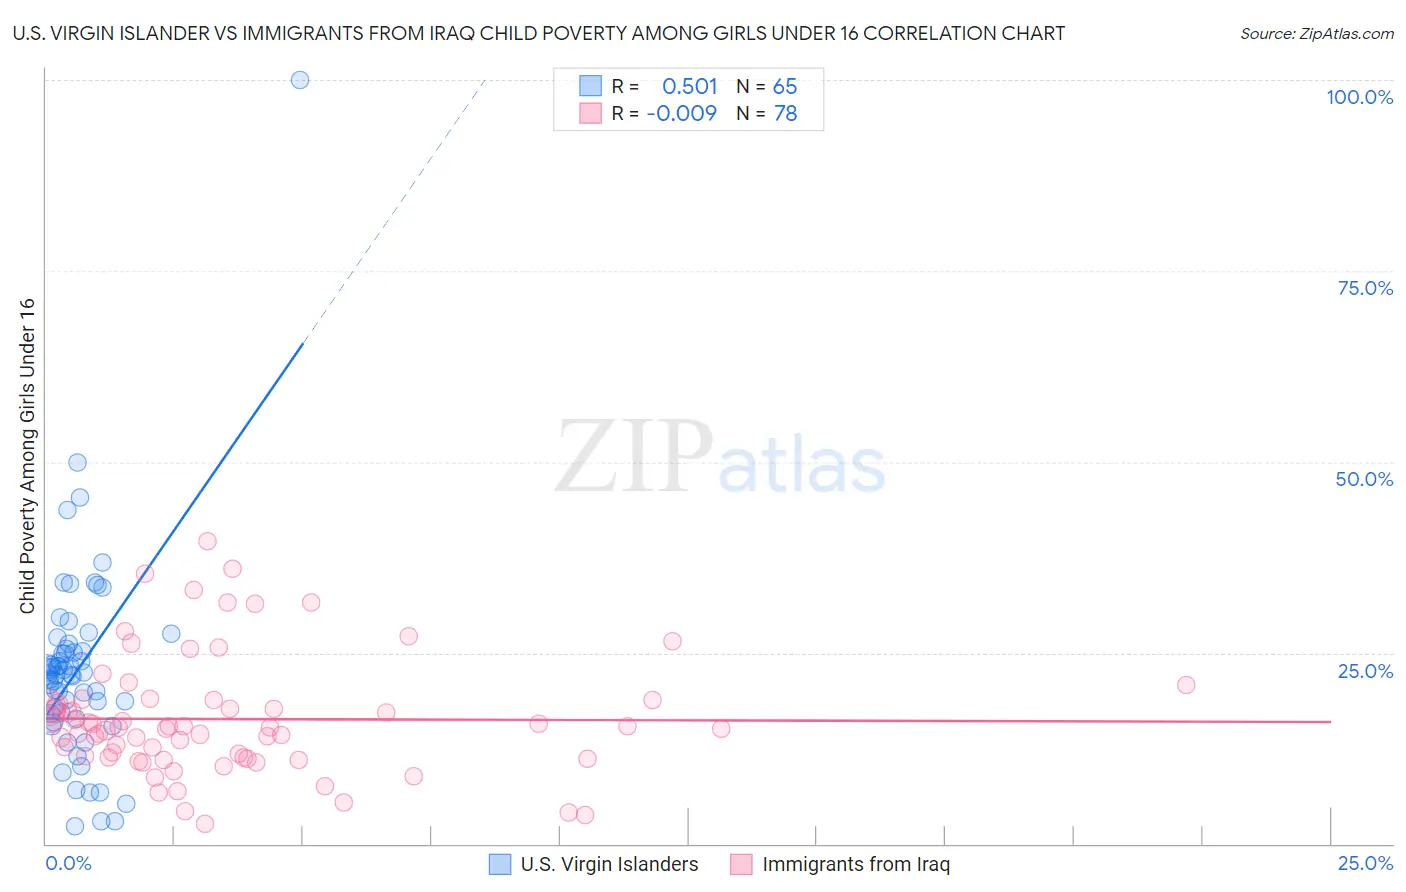
U.S. Virgin Islander vs Immigrants from Iraq Child Poverty Among Girls Under 16 Correlation Chart
The statistical analysis conducted on geographies consisting of 87,265,744 people shows a substantial positive correlation between the proportion of U.S. Virgin Islanders and poverty level among girls under the age of 16 in the United States with a correlation coefficient (R) of 0.501 and weighted average of 22.1%. Similarly, the statistical analysis conducted on geographies consisting of 193,254,093 people shows no correlation between the proportion of Immigrants from Iraq and poverty level among girls under the age of 16 in the United States with a correlation coefficient (R) of -0.009 and weighted average of 16.6%, a difference of 33.2%.
Child Poverty Among Girls Under 16 Correlation Summary
| Measurement | U.S. Virgin Islander | Immigrants from Iraq |
| Minimum | 2.3% | 2.6% |
| Maximum | 100.0% | 39.6% |
| Range | 97.7% | 37.1% |
| Mean | 22.9% | 16.3% |
| Median | 22.1% | 15.1% |
| Interquartile 25% (IQ1) | 16.7% | 11.3% |
| Interquartile 75% (IQ3) | 25.9% | 18.8% |
| Interquartile Range (IQR) | 9.2% | 7.5% |
| Standard Deviation (Sample) | 13.7% | 7.8% |
| Standard Deviation (Population) | 13.6% | 7.7% |
Similar Demographics by Child Poverty Among Girls Under 16
Demographics Similar to U.S. Virgin Islanders by Child Poverty Among Girls Under 16
In terms of child poverty among girls under 16, the demographic groups most similar to U.S. Virgin Islanders are Immigrants from Dominica (22.1%, a difference of 0.16%), Honduran (22.2%, a difference of 0.60%), African (21.9%, a difference of 0.82%), Immigrants from Guatemala (21.9%, a difference of 1.1%), and Ute (21.8%, a difference of 1.4%).
| Demographics | Rating | Rank | Child Poverty Among Girls Under 16 |
| Immigrants | Mexico | 0.0 /100 | #312 | Tragic 21.6% |
| Creek | 0.0 /100 | #313 | Tragic 21.7% |
| Arapaho | 0.0 /100 | #314 | Tragic 21.7% |
| Ute | 0.0 /100 | #315 | Tragic 21.8% |
| Immigrants | Guatemala | 0.0 /100 | #316 | Tragic 21.9% |
| Africans | 0.0 /100 | #317 | Tragic 21.9% |
| Immigrants | Dominica | 0.0 /100 | #318 | Tragic 22.1% |
| U.S. Virgin Islanders | 0.0 /100 | #319 | Tragic 22.1% |
| Hondurans | 0.0 /100 | #320 | Tragic 22.2% |
| Colville | 0.0 /100 | #321 | Tragic 22.5% |
| Yakama | 0.0 /100 | #322 | Tragic 22.6% |
| Cajuns | 0.0 /100 | #323 | Tragic 22.6% |
| Paiute | 0.0 /100 | #324 | Tragic 22.6% |
| Immigrants | Congo | 0.0 /100 | #325 | Tragic 22.7% |
| Immigrants | Honduras | 0.0 /100 | #326 | Tragic 22.8% |
Demographics Similar to Immigrants from Iraq by Child Poverty Among Girls Under 16
In terms of child poverty among girls under 16, the demographic groups most similar to Immigrants from Iraq are Immigrants from Ethiopia (16.6%, a difference of 0.010%), Immigrants from Syria (16.6%, a difference of 0.020%), Hawaiian (16.6%, a difference of 0.030%), White/Caucasian (16.6%, a difference of 0.060%), and Immigrants from Portugal (16.6%, a difference of 0.080%).
| Demographics | Rating | Rank | Child Poverty Among Girls Under 16 |
| Ethiopians | 50.0 /100 | #174 | Average 16.5% |
| Lebanese | 45.4 /100 | #175 | Average 16.6% |
| Hungarians | 45.1 /100 | #176 | Average 16.6% |
| Immigrants | Western Asia | 44.1 /100 | #177 | Average 16.6% |
| Whites/Caucasians | 43.6 /100 | #178 | Average 16.6% |
| Hawaiians | 43.4 /100 | #179 | Average 16.6% |
| Immigrants | Syria | 43.3 /100 | #180 | Average 16.6% |
| Immigrants | Iraq | 43.2 /100 | #181 | Average 16.6% |
| Immigrants | Ethiopia | 43.1 /100 | #182 | Average 16.6% |
| Immigrants | Portugal | 42.5 /100 | #183 | Average 16.6% |
| Scotch-Irish | 39.6 /100 | #184 | Fair 16.7% |
| Immigrants | Uruguay | 35.6 /100 | #185 | Fair 16.7% |
| South American Indians | 35.0 /100 | #186 | Fair 16.8% |
| Immigrants | Morocco | 34.6 /100 | #187 | Fair 16.8% |
| Arabs | 34.5 /100 | #188 | Fair 16.8% |