Trinidadian and Tobagonian vs Puerto Rican Single Father Poverty
COMPARE
Trinidadian and Tobagonian
Puerto Rican
Single Father Poverty
Single Father Poverty Comparison
Trinidadians and Tobagonians
Puerto Ricans
17.0%
SINGLE FATHER POVERTY
1.5/ 100
METRIC RATING
245th/ 347
METRIC RANK
31.5%
SINGLE FATHER POVERTY
0.0/ 100
METRIC RATING
346th/ 347
METRIC RANK
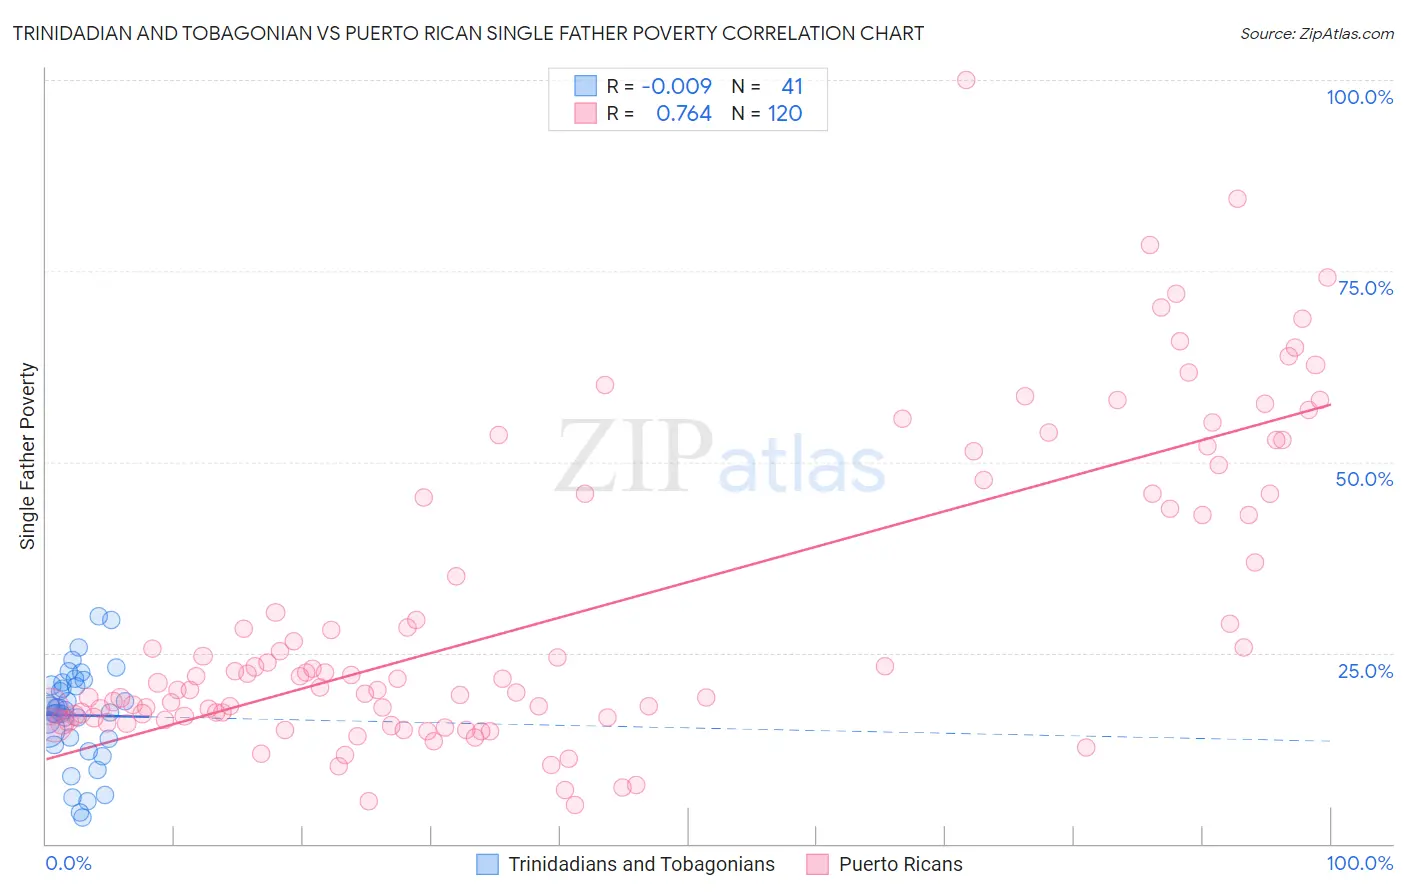
Trinidadian and Tobagonian vs Puerto Rican Single Father Poverty Correlation Chart
The statistical analysis conducted on geographies consisting of 188,831,779 people shows no correlation between the proportion of Trinidadians and Tobagonians and poverty level among single fathers in the United States with a correlation coefficient (R) of -0.009 and weighted average of 17.0%. Similarly, the statistical analysis conducted on geographies consisting of 394,843,962 people shows a strong positive correlation between the proportion of Puerto Ricans and poverty level among single fathers in the United States with a correlation coefficient (R) of 0.764 and weighted average of 31.5%, a difference of 84.9%.
Single Father Poverty Correlation Summary
| Measurement | Trinidadian and Tobagonian | Puerto Rican |
| Minimum | 3.5% | 5.1% |
| Maximum | 29.7% | 100.0% |
| Range | 26.2% | 94.9% |
| Mean | 16.8% | 30.4% |
| Median | 17.5% | 21.8% |
| Interquartile 25% (IQ1) | 13.4% | 16.6% |
| Interquartile 75% (IQ3) | 20.9% | 45.8% |
| Interquartile Range (IQR) | 7.6% | 29.2% |
| Standard Deviation (Sample) | 6.3% | 20.1% |
| Standard Deviation (Population) | 6.2% | 20.0% |
Similar Demographics by Single Father Poverty
Demographics Similar to Trinidadians and Tobagonians by Single Father Poverty
In terms of single father poverty, the demographic groups most similar to Trinidadians and Tobagonians are Honduran (17.0%, a difference of 0.040%), Immigrants from Ireland (17.1%, a difference of 0.040%), Immigrants from Cabo Verde (17.0%, a difference of 0.060%), Greek (17.1%, a difference of 0.14%), and Czechoslovakian (17.1%, a difference of 0.14%).
| Demographics | Rating | Rank | Single Father Poverty |
| Immigrants | Saudi Arabia | 2.7 /100 | #238 | Tragic 16.9% |
| Bermudans | 2.6 /100 | #239 | Tragic 16.9% |
| Finns | 2.6 /100 | #240 | Tragic 16.9% |
| Czechs | 2.3 /100 | #241 | Tragic 17.0% |
| Moroccans | 2.1 /100 | #242 | Tragic 17.0% |
| Immigrants | Cabo Verde | 1.6 /100 | #243 | Tragic 17.0% |
| Hondurans | 1.6 /100 | #244 | Tragic 17.0% |
| Trinidadians and Tobagonians | 1.5 /100 | #245 | Tragic 17.0% |
| Immigrants | Ireland | 1.4 /100 | #246 | Tragic 17.1% |
| Greeks | 1.3 /100 | #247 | Tragic 17.1% |
| Czechoslovakians | 1.3 /100 | #248 | Tragic 17.1% |
| Canadians | 1.3 /100 | #249 | Tragic 17.1% |
| Austrians | 1.1 /100 | #250 | Tragic 17.1% |
| Luxembourgers | 1.1 /100 | #251 | Tragic 17.1% |
| Croatians | 1.0 /100 | #252 | Tragic 17.1% |
Demographics Similar to Puerto Ricans by Single Father Poverty
In terms of single father poverty, the demographic groups most similar to Puerto Ricans are Yup'ik (32.5%, a difference of 3.2%), Crow (30.3%, a difference of 4.1%), Navajo (29.2%, a difference of 7.9%), Lumbee (28.5%, a difference of 10.7%), and Yuman (28.4%, a difference of 11.0%).
| Demographics | Rating | Rank | Single Father Poverty |
| Natives/Alaskans | 0.0 /100 | #333 | Tragic 22.4% |
| Kiowa | 0.0 /100 | #334 | Tragic 22.5% |
| Shoshone | 0.0 /100 | #335 | Tragic 22.9% |
| Cajuns | 0.0 /100 | #336 | Tragic 23.1% |
| Sioux | 0.0 /100 | #337 | Tragic 23.9% |
| Arapaho | 0.0 /100 | #338 | Tragic 24.0% |
| Apache | 0.0 /100 | #339 | Tragic 24.2% |
| Houma | 0.0 /100 | #340 | Tragic 26.7% |
| Hopi | 0.0 /100 | #341 | Tragic 27.2% |
| Yuman | 0.0 /100 | #342 | Tragic 28.4% |
| Lumbee | 0.0 /100 | #343 | Tragic 28.5% |
| Navajo | 0.0 /100 | #344 | Tragic 29.2% |
| Crow | 0.0 /100 | #345 | Tragic 30.3% |
| Puerto Ricans | 0.0 /100 | #346 | Tragic 31.5% |
| Yup'ik | 0.0 /100 | #347 | Tragic 32.5% |