Scandinavian vs Puerto Rican Single Father Poverty
COMPARE
Scandinavian
Puerto Rican
Single Father Poverty
Single Father Poverty Comparison
Scandinavians
Puerto Ricans
16.3%
SINGLE FATHER POVERTY
52.3/ 100
METRIC RATING
170th/ 347
METRIC RANK
31.5%
SINGLE FATHER POVERTY
0.0/ 100
METRIC RATING
346th/ 347
METRIC RANK
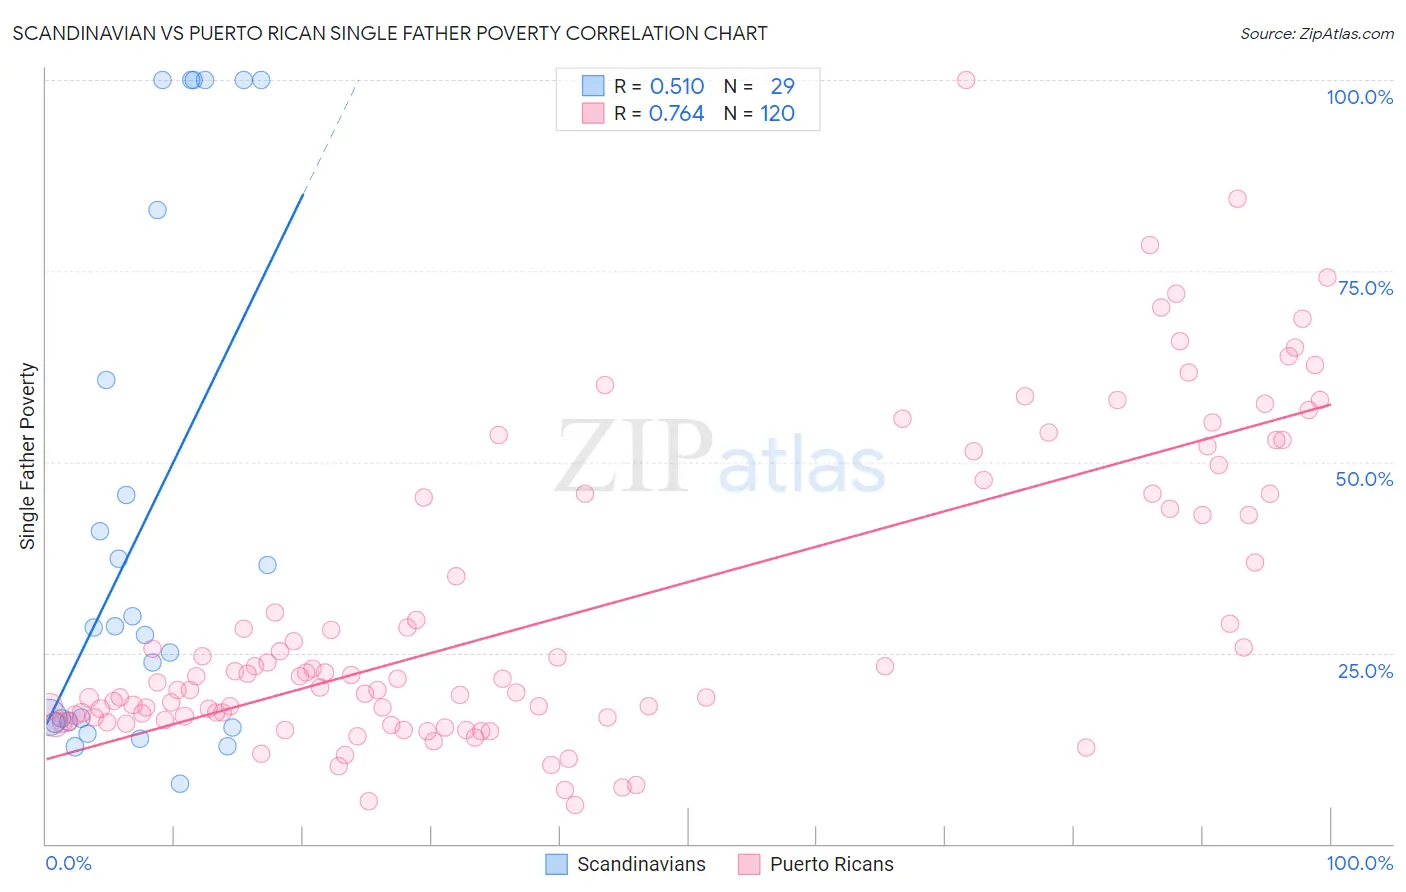
Scandinavian vs Puerto Rican Single Father Poverty Correlation Chart
The statistical analysis conducted on geographies consisting of 353,551,665 people shows a substantial positive correlation between the proportion of Scandinavians and poverty level among single fathers in the United States with a correlation coefficient (R) of 0.510 and weighted average of 16.3%. Similarly, the statistical analysis conducted on geographies consisting of 394,843,962 people shows a strong positive correlation between the proportion of Puerto Ricans and poverty level among single fathers in the United States with a correlation coefficient (R) of 0.764 and weighted average of 31.5%, a difference of 93.6%.
Single Father Poverty Correlation Summary
| Measurement | Scandinavian | Puerto Rican |
| Minimum | 7.8% | 5.1% |
| Maximum | 100.0% | 100.0% |
| Range | 92.2% | 94.9% |
| Mean | 42.2% | 30.4% |
| Median | 28.3% | 21.8% |
| Interquartile 25% (IQ1) | 15.9% | 16.6% |
| Interquartile 75% (IQ3) | 71.8% | 45.8% |
| Interquartile Range (IQR) | 55.9% | 29.2% |
| Standard Deviation (Sample) | 33.9% | 20.1% |
| Standard Deviation (Population) | 33.3% | 20.0% |
Similar Demographics by Single Father Poverty
Demographics Similar to Scandinavians by Single Father Poverty
In terms of single father poverty, the demographic groups most similar to Scandinavians are Northern European (16.3%, a difference of 0.020%), Costa Rican (16.3%, a difference of 0.060%), Yugoslavian (16.3%, a difference of 0.070%), Immigrants from Morocco (16.3%, a difference of 0.070%), and Immigrants from Sierra Leone (16.3%, a difference of 0.10%).
| Demographics | Rating | Rank | Single Father Poverty |
| Immigrants | Costa Rica | 55.7 /100 | #163 | Average 16.3% |
| Guyanese | 55.2 /100 | #164 | Average 16.3% |
| Immigrants | Bangladesh | 55.1 /100 | #165 | Average 16.3% |
| Immigrants | Europe | 54.8 /100 | #166 | Average 16.3% |
| Yugoslavians | 53.9 /100 | #167 | Average 16.3% |
| Costa Ricans | 53.6 /100 | #168 | Average 16.3% |
| Northern Europeans | 52.8 /100 | #169 | Average 16.3% |
| Scandinavians | 52.3 /100 | #170 | Average 16.3% |
| Immigrants | Morocco | 50.7 /100 | #171 | Average 16.3% |
| Immigrants | Sierra Leone | 50.1 /100 | #172 | Average 16.3% |
| Immigrants | St. Vincent and the Grenadines | 50.0 /100 | #173 | Average 16.3% |
| Swedes | 50.0 /100 | #174 | Average 16.3% |
| Immigrants | Ecuador | 49.7 /100 | #175 | Average 16.3% |
| Vietnamese | 48.0 /100 | #176 | Average 16.3% |
| Immigrants | South Africa | 44.2 /100 | #177 | Average 16.3% |
Demographics Similar to Puerto Ricans by Single Father Poverty
In terms of single father poverty, the demographic groups most similar to Puerto Ricans are Yup'ik (32.5%, a difference of 3.2%), Crow (30.3%, a difference of 4.1%), Navajo (29.2%, a difference of 7.9%), Lumbee (28.5%, a difference of 10.7%), and Yuman (28.4%, a difference of 11.0%).
| Demographics | Rating | Rank | Single Father Poverty |
| Natives/Alaskans | 0.0 /100 | #333 | Tragic 22.4% |
| Kiowa | 0.0 /100 | #334 | Tragic 22.5% |
| Shoshone | 0.0 /100 | #335 | Tragic 22.9% |
| Cajuns | 0.0 /100 | #336 | Tragic 23.1% |
| Sioux | 0.0 /100 | #337 | Tragic 23.9% |
| Arapaho | 0.0 /100 | #338 | Tragic 24.0% |
| Apache | 0.0 /100 | #339 | Tragic 24.2% |
| Houma | 0.0 /100 | #340 | Tragic 26.7% |
| Hopi | 0.0 /100 | #341 | Tragic 27.2% |
| Yuman | 0.0 /100 | #342 | Tragic 28.4% |
| Lumbee | 0.0 /100 | #343 | Tragic 28.5% |
| Navajo | 0.0 /100 | #344 | Tragic 29.2% |
| Crow | 0.0 /100 | #345 | Tragic 30.3% |
| Puerto Ricans | 0.0 /100 | #346 | Tragic 31.5% |
| Yup'ik | 0.0 /100 | #347 | Tragic 32.5% |