Serbian vs Immigrants from Dominica Single Father Poverty
COMPARE
Serbian
Immigrants from Dominica
Single Father Poverty
Single Father Poverty Comparison
Serbians
Immigrants from Dominica
16.4%
SINGLE FATHER POVERTY
40.9/ 100
METRIC RATING
179th/ 347
METRIC RANK
18.9%
SINGLE FATHER POVERTY
0.0/ 100
METRIC RATING
312th/ 347
METRIC RANK
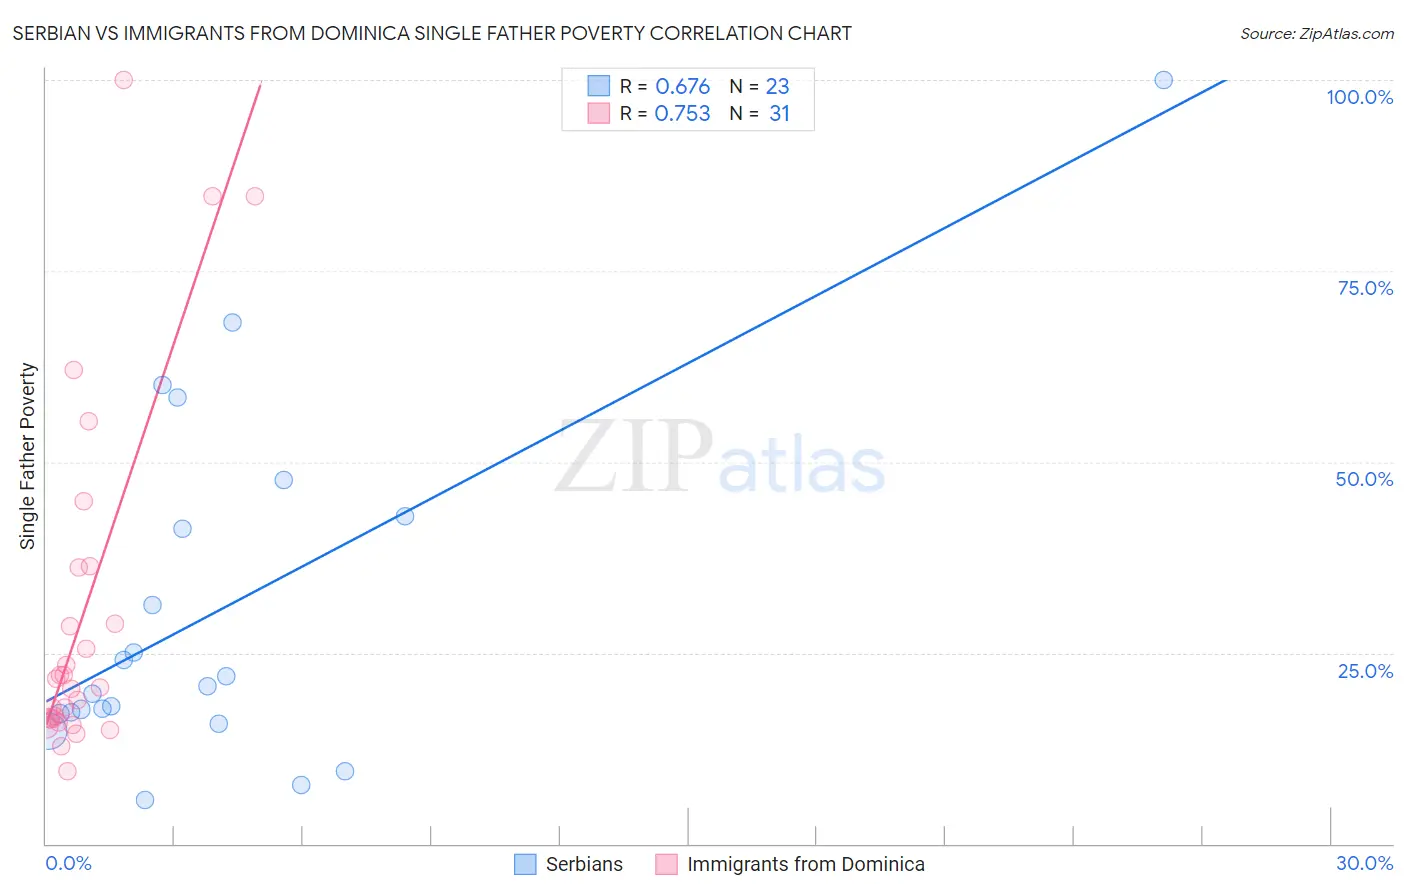
Serbian vs Immigrants from Dominica Single Father Poverty Correlation Chart
The statistical analysis conducted on geographies consisting of 216,450,025 people shows a significant positive correlation between the proportion of Serbians and poverty level among single fathers in the United States with a correlation coefficient (R) of 0.676 and weighted average of 16.4%. Similarly, the statistical analysis conducted on geographies consisting of 78,251,177 people shows a strong positive correlation between the proportion of Immigrants from Dominica and poverty level among single fathers in the United States with a correlation coefficient (R) of 0.753 and weighted average of 18.9%, a difference of 15.2%.
Single Father Poverty Correlation Summary
| Measurement | Serbian | Immigrants from Dominica |
| Minimum | 5.7% | 9.4% |
| Maximum | 100.0% | 100.0% |
| Range | 94.3% | 90.6% |
| Mean | 30.5% | 30.2% |
| Median | 20.7% | 20.5% |
| Interquartile 25% (IQ1) | 17.0% | 16.4% |
| Interquartile 75% (IQ3) | 42.9% | 36.1% |
| Interquartile Range (IQR) | 25.8% | 19.7% |
| Standard Deviation (Sample) | 23.1% | 23.3% |
| Standard Deviation (Population) | 22.6% | 22.9% |
Similar Demographics by Single Father Poverty
Demographics Similar to Serbians by Single Father Poverty
In terms of single father poverty, the demographic groups most similar to Serbians are Immigrants from Cuba (16.4%, a difference of 0.030%), Immigrants from South Africa (16.3%, a difference of 0.15%), Immigrants from Latin America (16.4%, a difference of 0.17%), Immigrants from Western Africa (16.4%, a difference of 0.23%), and Immigrants from Italy (16.4%, a difference of 0.24%).
| Demographics | Rating | Rank | Single Father Poverty |
| Immigrants | Sierra Leone | 50.1 /100 | #172 | Average 16.3% |
| Immigrants | St. Vincent and the Grenadines | 50.0 /100 | #173 | Average 16.3% |
| Swedes | 50.0 /100 | #174 | Average 16.3% |
| Immigrants | Ecuador | 49.7 /100 | #175 | Average 16.3% |
| Vietnamese | 48.0 /100 | #176 | Average 16.3% |
| Immigrants | South Africa | 44.2 /100 | #177 | Average 16.3% |
| Immigrants | Cuba | 41.6 /100 | #178 | Average 16.4% |
| Serbians | 40.9 /100 | #179 | Average 16.4% |
| Immigrants | Latin America | 37.2 /100 | #180 | Fair 16.4% |
| Immigrants | Western Africa | 36.0 /100 | #181 | Fair 16.4% |
| Immigrants | Italy | 35.7 /100 | #182 | Fair 16.4% |
| Aleuts | 35.3 /100 | #183 | Fair 16.4% |
| Cambodians | 34.6 /100 | #184 | Fair 16.4% |
| Panamanians | 33.6 /100 | #185 | Fair 16.4% |
| Immigrants | Venezuela | 31.0 /100 | #186 | Fair 16.4% |
Demographics Similar to Immigrants from Dominica by Single Father Poverty
In terms of single father poverty, the demographic groups most similar to Immigrants from Dominica are Nonimmigrants (18.8%, a difference of 0.050%), Potawatomi (18.9%, a difference of 0.20%), Chippewa (18.8%, a difference of 0.24%), Delaware (18.9%, a difference of 0.36%), and Chickasaw (19.0%, a difference of 0.52%).
| Demographics | Rating | Rank | Single Father Poverty |
| Blackfeet | 0.0 /100 | #305 | Tragic 18.5% |
| Scotch-Irish | 0.0 /100 | #306 | Tragic 18.6% |
| French Canadians | 0.0 /100 | #307 | Tragic 18.6% |
| Ottawa | 0.0 /100 | #308 | Tragic 18.6% |
| Immigrants | Micronesia | 0.0 /100 | #309 | Tragic 18.6% |
| Chippewa | 0.0 /100 | #310 | Tragic 18.8% |
| Immigrants | Nonimmigrants | 0.0 /100 | #311 | Tragic 18.8% |
| Immigrants | Dominica | 0.0 /100 | #312 | Tragic 18.9% |
| Potawatomi | 0.0 /100 | #313 | Tragic 18.9% |
| Delaware | 0.0 /100 | #314 | Tragic 18.9% |
| Chickasaw | 0.0 /100 | #315 | Tragic 19.0% |
| Osage | 0.0 /100 | #316 | Tragic 19.0% |
| Dominicans | 0.0 /100 | #317 | Tragic 19.1% |
| Dutch West Indians | 0.0 /100 | #318 | Tragic 19.2% |
| Slovaks | 0.0 /100 | #319 | Tragic 19.3% |