Uruguayan vs Dominican Family Poverty
COMPARE
Uruguayan
Dominican
Family Poverty
Family Poverty Comparison
Uruguayans
Dominicans
9.1%
FAMILY POVERTY
39.2/ 100
METRIC RATING
183rd/ 347
METRIC RANK
14.3%
FAMILY POVERTY
0.0/ 100
METRIC RATING
332nd/ 347
METRIC RANK
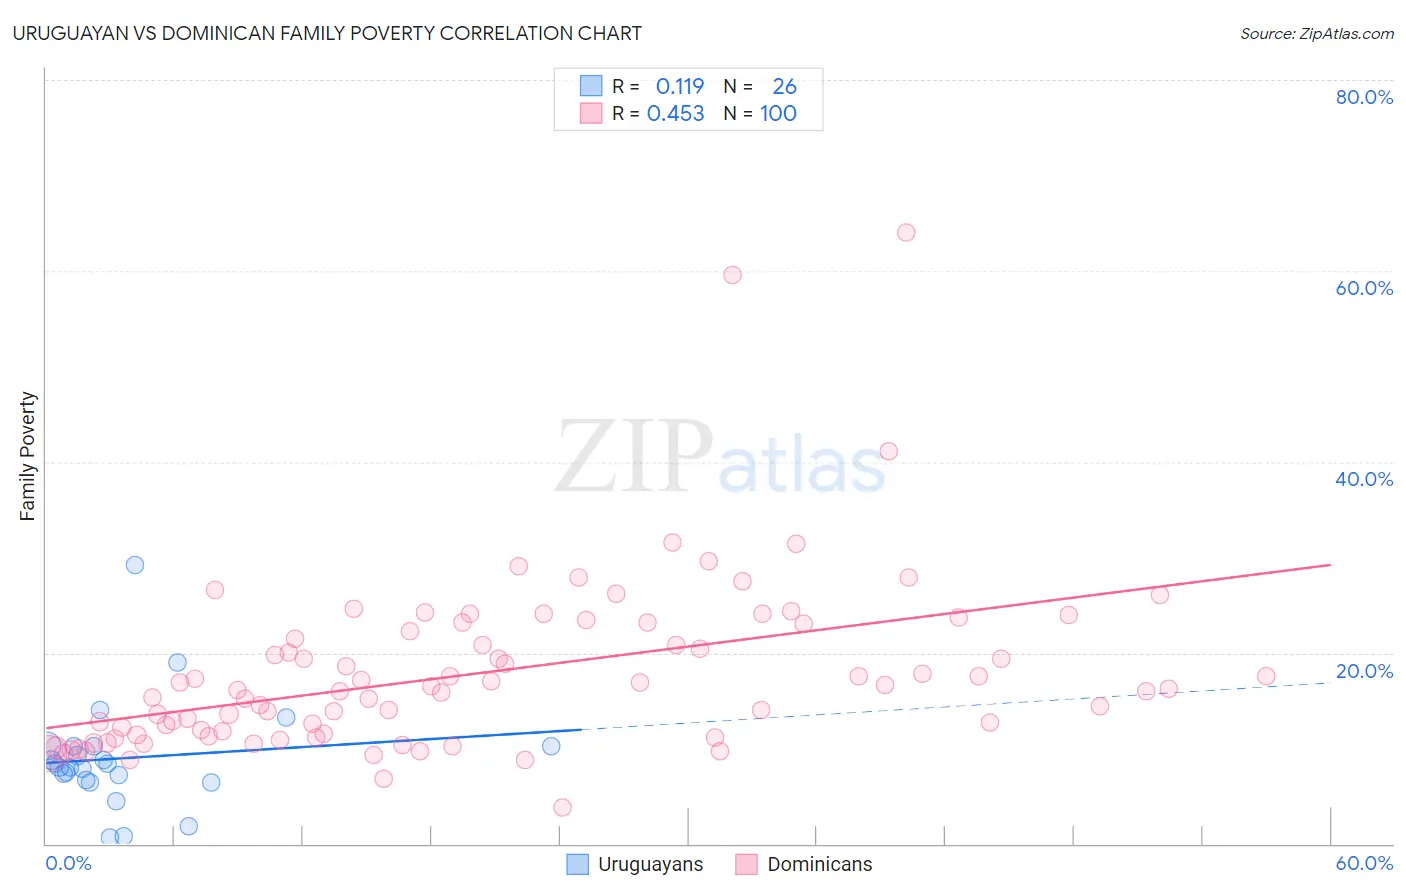
Uruguayan vs Dominican Family Poverty Correlation Chart
The statistical analysis conducted on geographies consisting of 144,644,922 people shows a poor positive correlation between the proportion of Uruguayans and poverty level among families in the United States with a correlation coefficient (R) of 0.119 and weighted average of 9.1%. Similarly, the statistical analysis conducted on geographies consisting of 353,965,759 people shows a moderate positive correlation between the proportion of Dominicans and poverty level among families in the United States with a correlation coefficient (R) of 0.453 and weighted average of 14.3%, a difference of 57.0%.
Family Poverty Correlation Summary
| Measurement | Uruguayan | Dominican |
| Minimum | 0.67% | 3.8% |
| Maximum | 29.2% | 64.0% |
| Range | 28.5% | 60.2% |
| Mean | 9.0% | 17.9% |
| Median | 8.2% | 16.1% |
| Interquartile 25% (IQ1) | 6.7% | 11.4% |
| Interquartile 75% (IQ3) | 10.2% | 22.6% |
| Interquartile Range (IQR) | 3.5% | 11.2% |
| Standard Deviation (Sample) | 5.7% | 9.1% |
| Standard Deviation (Population) | 5.5% | 9.1% |
Similar Demographics by Family Poverty
Demographics Similar to Uruguayans by Family Poverty
In terms of family poverty, the demographic groups most similar to Uruguayans are South American Indian (9.1%, a difference of 0.070%), Immigrants from Saudi Arabia (9.1%, a difference of 0.080%), Immigrants from Morocco (9.1%, a difference of 0.13%), Hmong (9.1%, a difference of 0.14%), and Colombian (9.2%, a difference of 0.43%).
| Demographics | Rating | Rank | Family Poverty |
| Immigrants | Syria | 47.5 /100 | #176 | Average 9.0% |
| Hawaiians | 47.2 /100 | #177 | Average 9.0% |
| Immigrants | Cameroon | 47.1 /100 | #178 | Average 9.0% |
| Immigrants | Iraq | 44.4 /100 | #179 | Average 9.1% |
| Immigrants | Uganda | 43.4 /100 | #180 | Average 9.1% |
| Hmong | 40.2 /100 | #181 | Average 9.1% |
| Immigrants | Morocco | 40.2 /100 | #182 | Average 9.1% |
| Uruguayans | 39.2 /100 | #183 | Fair 9.1% |
| South American Indians | 38.7 /100 | #184 | Fair 9.1% |
| Immigrants | Saudi Arabia | 38.6 /100 | #185 | Fair 9.1% |
| Colombians | 36.1 /100 | #186 | Fair 9.2% |
| Delaware | 35.4 /100 | #187 | Fair 9.2% |
| Immigrants | Kenya | 34.0 /100 | #188 | Fair 9.2% |
| Immigrants | Afghanistan | 32.1 /100 | #189 | Fair 9.2% |
| Arabs | 31.5 /100 | #190 | Fair 9.2% |
Demographics Similar to Dominicans by Family Poverty
In terms of family poverty, the demographic groups most similar to Dominicans are Cheyenne (14.3%, a difference of 0.44%), Native/Alaskan (14.3%, a difference of 0.58%), Immigrants from Dominican Republic (14.4%, a difference of 0.63%), Houma (14.6%, a difference of 1.9%), and Apache (14.7%, a difference of 2.8%).
| Demographics | Rating | Rank | Family Poverty |
| Paiute | 0.0 /100 | #325 | Tragic 13.0% |
| Colville | 0.0 /100 | #326 | Tragic 13.0% |
| Yakama | 0.0 /100 | #327 | Tragic 13.1% |
| Central American Indians | 0.0 /100 | #328 | Tragic 13.3% |
| Blacks/African Americans | 0.0 /100 | #329 | Tragic 13.3% |
| Natives/Alaskans | 0.0 /100 | #330 | Tragic 14.3% |
| Cheyenne | 0.0 /100 | #331 | Tragic 14.3% |
| Dominicans | 0.0 /100 | #332 | Tragic 14.3% |
| Immigrants | Dominican Republic | 0.0 /100 | #333 | Tragic 14.4% |
| Houma | 0.0 /100 | #334 | Tragic 14.6% |
| Apache | 0.0 /100 | #335 | Tragic 14.7% |
| Sioux | 0.0 /100 | #336 | Tragic 15.9% |
| Hopi | 0.0 /100 | #337 | Tragic 15.9% |
| Crow | 0.0 /100 | #338 | Tragic 16.1% |
| Yuman | 0.0 /100 | #339 | Tragic 16.6% |