Uruguayan vs Mexican American Indian Family Poverty
COMPARE
Uruguayan
Mexican American Indian
Family Poverty
Family Poverty Comparison
Uruguayans
Mexican American Indians
9.1%
FAMILY POVERTY
39.2/ 100
METRIC RATING
183rd/ 347
METRIC RANK
10.9%
FAMILY POVERTY
0.2/ 100
METRIC RATING
259th/ 347
METRIC RANK
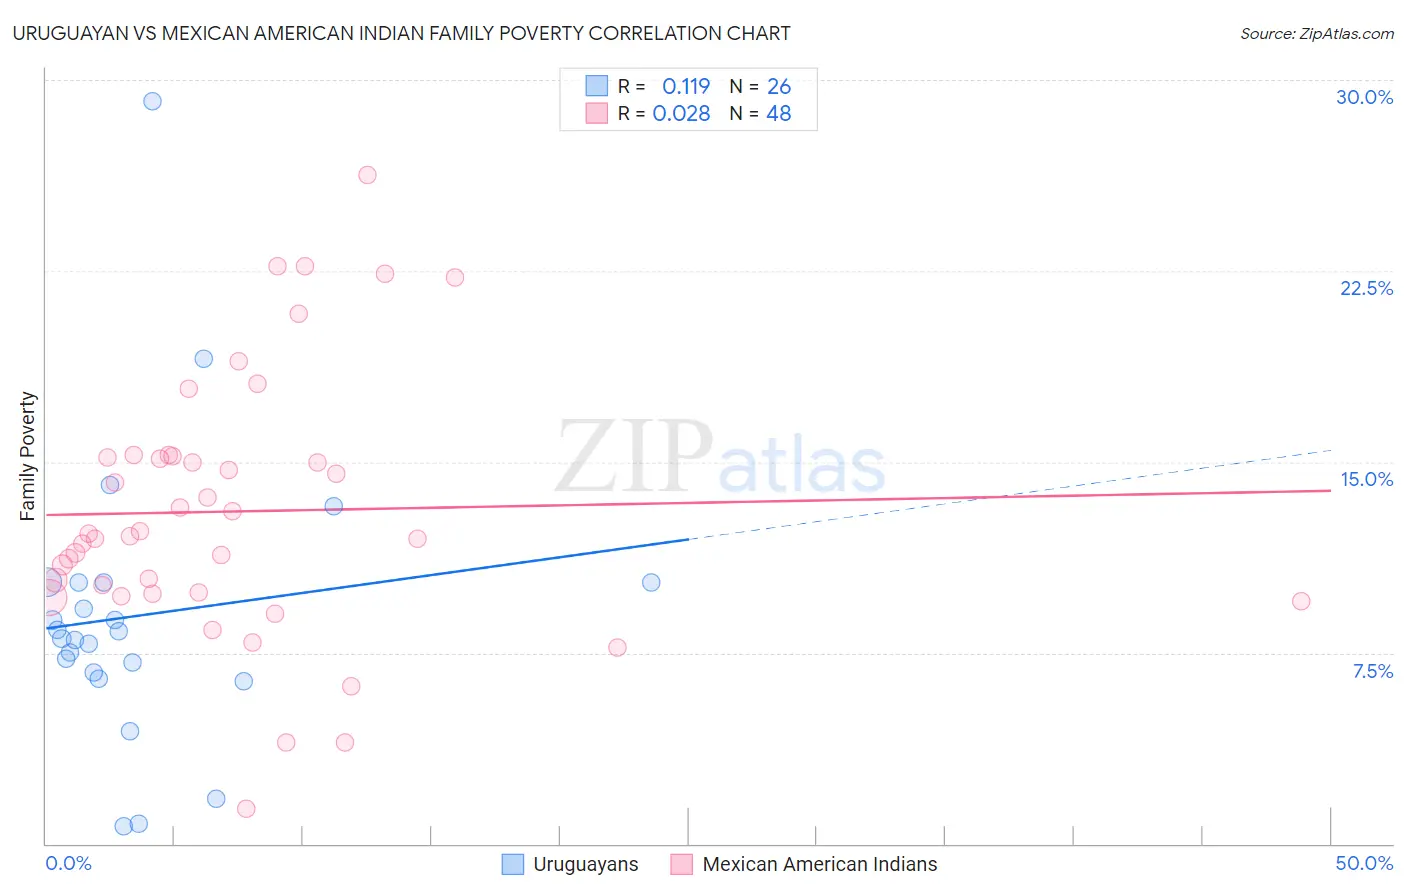
Uruguayan vs Mexican American Indian Family Poverty Correlation Chart
The statistical analysis conducted on geographies consisting of 144,644,922 people shows a poor positive correlation between the proportion of Uruguayans and poverty level among families in the United States with a correlation coefficient (R) of 0.119 and weighted average of 9.1%. Similarly, the statistical analysis conducted on geographies consisting of 317,307,658 people shows no correlation between the proportion of Mexican American Indians and poverty level among families in the United States with a correlation coefficient (R) of 0.028 and weighted average of 10.9%, a difference of 18.9%.
Family Poverty Correlation Summary
| Measurement | Uruguayan | Mexican American Indian |
| Minimum | 0.67% | 1.4% |
| Maximum | 29.2% | 26.3% |
| Range | 28.5% | 24.9% |
| Mean | 9.0% | 13.1% |
| Median | 8.2% | 12.1% |
| Interquartile 25% (IQ1) | 6.7% | 9.9% |
| Interquartile 75% (IQ3) | 10.2% | 15.2% |
| Interquartile Range (IQR) | 3.5% | 5.3% |
| Standard Deviation (Sample) | 5.7% | 5.2% |
| Standard Deviation (Population) | 5.5% | 5.1% |
Similar Demographics by Family Poverty
Demographics Similar to Uruguayans by Family Poverty
In terms of family poverty, the demographic groups most similar to Uruguayans are South American Indian (9.1%, a difference of 0.070%), Immigrants from Saudi Arabia (9.1%, a difference of 0.080%), Immigrants from Morocco (9.1%, a difference of 0.13%), Hmong (9.1%, a difference of 0.14%), and Colombian (9.2%, a difference of 0.43%).
| Demographics | Rating | Rank | Family Poverty |
| Immigrants | Syria | 47.5 /100 | #176 | Average 9.0% |
| Hawaiians | 47.2 /100 | #177 | Average 9.0% |
| Immigrants | Cameroon | 47.1 /100 | #178 | Average 9.0% |
| Immigrants | Iraq | 44.4 /100 | #179 | Average 9.1% |
| Immigrants | Uganda | 43.4 /100 | #180 | Average 9.1% |
| Hmong | 40.2 /100 | #181 | Average 9.1% |
| Immigrants | Morocco | 40.2 /100 | #182 | Average 9.1% |
| Uruguayans | 39.2 /100 | #183 | Fair 9.1% |
| South American Indians | 38.7 /100 | #184 | Fair 9.1% |
| Immigrants | Saudi Arabia | 38.6 /100 | #185 | Fair 9.1% |
| Colombians | 36.1 /100 | #186 | Fair 9.2% |
| Delaware | 35.4 /100 | #187 | Fair 9.2% |
| Immigrants | Kenya | 34.0 /100 | #188 | Fair 9.2% |
| Immigrants | Afghanistan | 32.1 /100 | #189 | Fair 9.2% |
| Arabs | 31.5 /100 | #190 | Fair 9.2% |
Demographics Similar to Mexican American Indians by Family Poverty
In terms of family poverty, the demographic groups most similar to Mexican American Indians are Subsaharan African (10.9%, a difference of 0.040%), Immigrants from Ghana (10.8%, a difference of 0.070%), Chickasaw (10.8%, a difference of 0.11%), Bangladeshi (10.9%, a difference of 0.35%), and Immigrants from Liberia (10.8%, a difference of 0.38%).
| Demographics | Rating | Rank | Family Poverty |
| Immigrants | Zaire | 0.3 /100 | #252 | Tragic 10.7% |
| Immigrants | Western Africa | 0.3 /100 | #253 | Tragic 10.7% |
| Ecuadorians | 0.2 /100 | #254 | Tragic 10.8% |
| Immigrants | Liberia | 0.2 /100 | #255 | Tragic 10.8% |
| Chickasaw | 0.2 /100 | #256 | Tragic 10.8% |
| Immigrants | Ghana | 0.2 /100 | #257 | Tragic 10.8% |
| Sub-Saharan Africans | 0.2 /100 | #258 | Tragic 10.9% |
| Mexican American Indians | 0.2 /100 | #259 | Tragic 10.9% |
| Bangladeshis | 0.2 /100 | #260 | Tragic 10.9% |
| Shoshone | 0.2 /100 | #261 | Tragic 10.9% |
| Spanish American Indians | 0.2 /100 | #262 | Tragic 10.9% |
| Cape Verdeans | 0.1 /100 | #263 | Tragic 10.9% |
| Trinidadians and Tobagonians | 0.1 /100 | #264 | Tragic 10.9% |
| Immigrants | Trinidad and Tobago | 0.1 /100 | #265 | Tragic 10.9% |
| Immigrants | El Salvador | 0.1 /100 | #266 | Tragic 11.0% |