Turkish vs Immigrants from Sweden Male Poverty
COMPARE
Turkish
Immigrants from Sweden
Male Poverty
Male Poverty Comparison
Turks
Immigrants from Sweden
10.0%
MALE POVERTY
98.9/ 100
METRIC RATING
46th/ 347
METRIC RANK
10.3%
MALE POVERTY
95.7/ 100
METRIC RATING
83rd/ 347
METRIC RANK
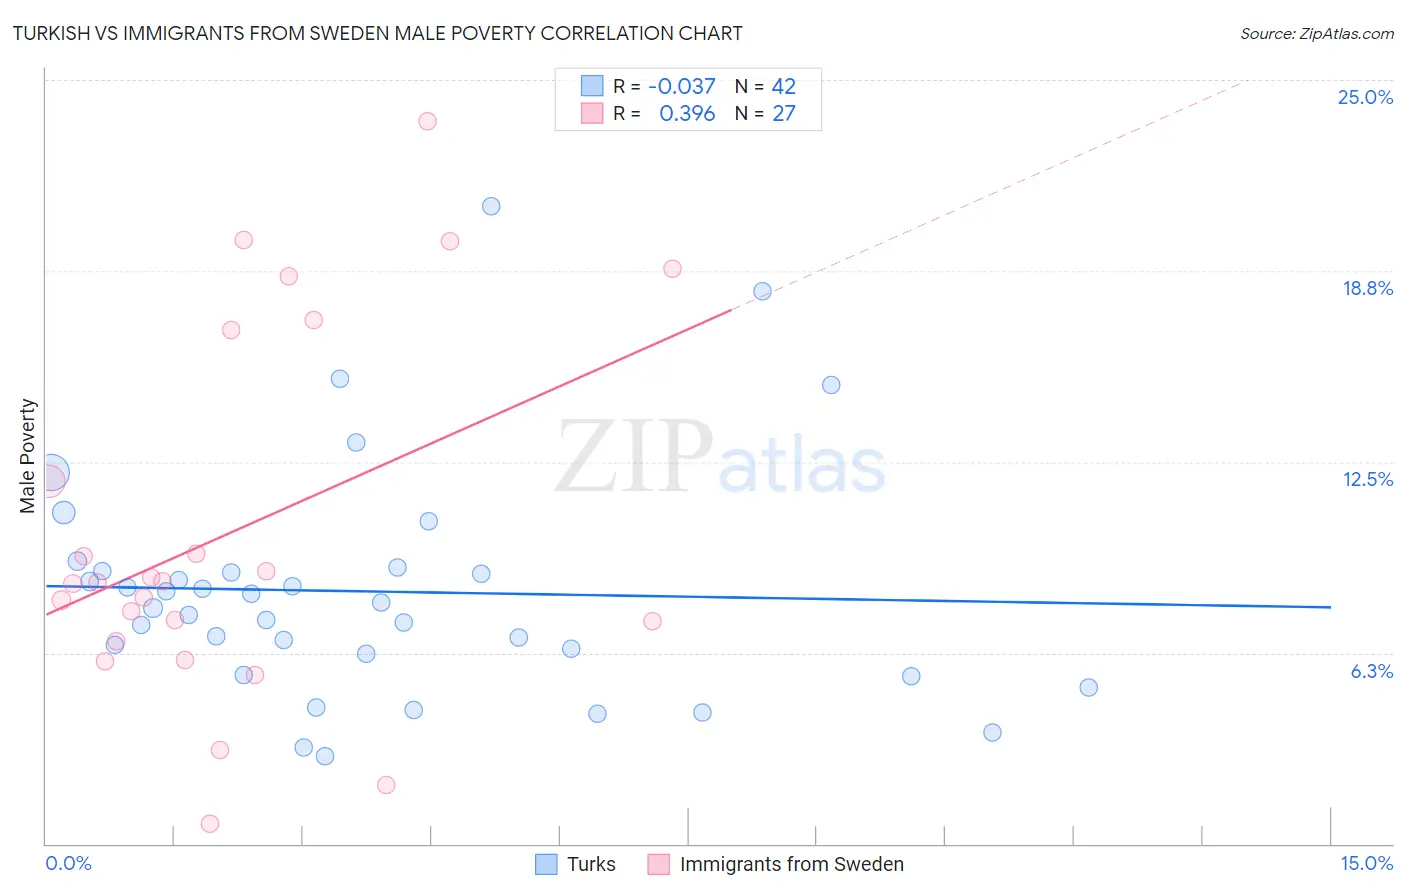
Turkish vs Immigrants from Sweden Male Poverty Correlation Chart
The statistical analysis conducted on geographies consisting of 271,656,534 people shows no correlation between the proportion of Turks and poverty level among males in the United States with a correlation coefficient (R) of -0.037 and weighted average of 10.0%. Similarly, the statistical analysis conducted on geographies consisting of 164,680,167 people shows a mild positive correlation between the proportion of Immigrants from Sweden and poverty level among males in the United States with a correlation coefficient (R) of 0.396 and weighted average of 10.3%, a difference of 3.7%.
Male Poverty Correlation Summary
| Measurement | Turkish | Immigrants from Sweden |
| Minimum | 2.9% | 0.65% |
| Maximum | 20.9% | 23.6% |
| Range | 18.0% | 23.0% |
| Mean | 8.3% | 10.2% |
| Median | 7.8% | 8.6% |
| Interquartile 25% (IQ1) | 6.2% | 6.6% |
| Interquartile 75% (IQ3) | 8.9% | 16.8% |
| Interquartile Range (IQR) | 2.7% | 10.2% |
| Standard Deviation (Sample) | 3.8% | 6.0% |
| Standard Deviation (Population) | 3.7% | 5.9% |
Similar Demographics by Male Poverty
Demographics Similar to Turks by Male Poverty
In terms of male poverty, the demographic groups most similar to Turks are Immigrants from Serbia (10.0%, a difference of 0.020%), Immigrants from Singapore (10.0%, a difference of 0.13%), Immigrants from Japan (10.0%, a difference of 0.13%), Immigrants from Romania (9.9%, a difference of 0.20%), and Slovene (10.0%, a difference of 0.23%).
| Demographics | Rating | Rank | Male Poverty |
| Russians | 99.2 /100 | #39 | Exceptional 9.9% |
| Cypriots | 99.2 /100 | #40 | Exceptional 9.9% |
| Koreans | 99.2 /100 | #41 | Exceptional 9.9% |
| Immigrants | Iran | 99.1 /100 | #42 | Exceptional 9.9% |
| Immigrants | Moldova | 99.0 /100 | #43 | Exceptional 9.9% |
| Immigrants | Romania | 98.9 /100 | #44 | Exceptional 9.9% |
| Immigrants | Serbia | 98.9 /100 | #45 | Exceptional 10.0% |
| Turks | 98.9 /100 | #46 | Exceptional 10.0% |
| Immigrants | Singapore | 98.8 /100 | #47 | Exceptional 10.0% |
| Immigrants | Japan | 98.8 /100 | #48 | Exceptional 10.0% |
| Slovenes | 98.8 /100 | #49 | Exceptional 10.0% |
| Immigrants | Philippines | 98.7 /100 | #50 | Exceptional 10.0% |
| Immigrants | Croatia | 98.7 /100 | #51 | Exceptional 10.0% |
| Asians | 98.7 /100 | #52 | Exceptional 10.0% |
| Immigrants | Czechoslovakia | 98.6 /100 | #53 | Exceptional 10.0% |
Demographics Similar to Immigrants from Sweden by Male Poverty
In terms of male poverty, the demographic groups most similar to Immigrants from Sweden are Czechoslovakian (10.3%, a difference of 0.060%), Immigrants from England (10.4%, a difference of 0.11%), Egyptian (10.3%, a difference of 0.12%), Belgian (10.3%, a difference of 0.13%), and Immigrants from Eastern Asia (10.4%, a difference of 0.25%).
| Demographics | Rating | Rank | Male Poverty |
| Dutch | 96.9 /100 | #76 | Exceptional 10.2% |
| Immigrants | Belgium | 96.8 /100 | #77 | Exceptional 10.3% |
| Irish | 96.8 /100 | #78 | Exceptional 10.3% |
| Immigrants | North America | 96.5 /100 | #79 | Exceptional 10.3% |
| English | 96.4 /100 | #80 | Exceptional 10.3% |
| Belgians | 95.9 /100 | #81 | Exceptional 10.3% |
| Egyptians | 95.9 /100 | #82 | Exceptional 10.3% |
| Immigrants | Sweden | 95.7 /100 | #83 | Exceptional 10.3% |
| Czechoslovakians | 95.6 /100 | #84 | Exceptional 10.3% |
| Immigrants | England | 95.5 /100 | #85 | Exceptional 10.4% |
| Immigrants | Eastern Asia | 95.3 /100 | #86 | Exceptional 10.4% |
| Northern Europeans | 95.2 /100 | #87 | Exceptional 10.4% |
| Cambodians | 95.0 /100 | #88 | Exceptional 10.4% |
| Immigrants | Denmark | 95.0 /100 | #89 | Exceptional 10.4% |
| Indians (Asian) | 94.9 /100 | #90 | Exceptional 10.4% |