Greek vs Immigrants from Sweden Male Poverty

COMPARE

Greek
Race
Ancestry
AfghanAfricanAlaska NativeAlaskan AthabascanAlbanianAleutAlsatianAmericanApacheArabArapahoArgentineanArmenianAssyrian/Chaldean/SyriacAustralianAustrianBahamianBangladeshiBarbadianBasqueBelgianBelizeanBermudanBhutaneseBlackfeetBolivianBrazilianBritishBritish West IndianBulgarianBurmeseCajunCambodianCanadianCape VerdeanCarpatho RusynCelticCentral AmericanCentral American IndianCherokeeCheyenneChickasawChileanChineseChippewaChoctawColombianColvilleComancheCosta RicanCreeCreekCroatianCrowCubanCypriotCzechCzechoslovakianDanishDelawareDominicanDutchDutch West IndianEastern EuropeanEcuadorianEgyptianEnglishEstonianEthiopianEuropeanFijianFilipinoFinnishFrenchFrench American IndianFrench CanadianGermanGerman RussianGhanaianGreekGuamanian/ChamorroGuatemalanGuyaneseHaitianHmongHonduranHopiHoumaHungarianIcelanderIndian (Asian)IndonesianInupiatIranianIraqiIrishIroquoisIsraeliItalianJamaicanJapaneseJordanianKenyanKiowaKoreanLaotianLatvianLebaneseLiberianLithuanianLumbeeLuxembourgerMacedonianMalaysianMalteseMarshalleseMenomineeMexicanMexican American IndianMongolianMoroccanNative HawaiianNavajoNepaleseNew ZealanderNicaraguanNigerianNorthern EuropeanNorwegianOkinawanOsageOttawaPaiutePakistaniPalestinianPanamanianParaguayanPennsylvania GermanPeruvianPimaPolishPortuguesePotawatomiPuebloPuerto RicanPuget Sound SalishRomanianRussianSalvadoranSamoanScandinavianScotch-IrishScottishSeminoleSenegaleseSerbianShoshoneSierra LeoneanSiouxSlavicSlovakSloveneSomaliSouth AfricanSouth AmericanSouth American IndianSoviet UnionSpaniardSpanishSpanish AmericanSpanish American IndianSri LankanSubsaharan AfricanSudaneseSwedishSwissSyrianTaiwaneseThaiTlingit-HaidaTohono O'OdhamTonganTrinidadian and TobagonianTsimshianTurkishU.S. Virgin IslanderUgandanUkrainianUruguayanUteVenezuelanVietnameseWelshWest IndianYakamaYaquiYugoslavianYumanYup'ikZimbabwean
Immigration
NonimmigrantsImmigrantsAfghanistanAfricaAlbaniaArgentinaArmeniaAsiaAustraliaAustriaBahamasBangladeshBarbadosBelarusBelgiumBelizeBoliviaBosnia and HerzegovinaBrazilBulgariaBurma/MyanmarCabo VerdeCambodiaCameroonCanadaCaribbeanCentral AmericaChileChinaColombiaCongoCosta RicaCroatiaCubaCzechoslovakiaDenmarkDominicaDominican RepublicEastern AfricaEastern AsiaEastern EuropeEcuadorEgyptEl SalvadorEnglandEritreaEthiopiaEuropeFijiFranceGermanyGhanaGreeceGrenadaGuatemalaGuyanaHaitiHondurasHong KongHungaryIndiaIndonesiaIranIraqIrelandIsraelItalyJamaicaJapanJordanKazakhstanKenyaKoreaKuwaitLaosLatin AmericaLatviaLebanonLiberiaLithuaniaMalaysiaMexicoMicronesiaMiddle AfricaMoldovaMoroccoNepalNetherlandsNicaraguaNigeriaNorth AmericaNorth MacedoniaNorthern AfricaNorthern EuropeNorwayOceaniaPakistanPanamaPeruPhilippinesPolandPortugalRomaniaRussiaSaudi ArabiaScotlandSenegalSerbiaSierra LeoneSingaporeSomaliaSouth AfricaSouth AmericaSouth Central AsiaSouth Eastern AsiaSouthern EuropeSpainSri LankaSt. Vincent and the GrenadinesSudanSwitzerlandSyriaTaiwanThailandTrinidad and TobagoTurkeyUgandaUkraineUruguayUzbekistanVenezuelaVietnamWest IndiesWestern AfricaWestern AsiaWestern EuropeYemenZaireZimbabweAzores
Immigrants from Sweden
Race
Ancestry
AfghanAfricanAlaska NativeAlaskan AthabascanAlbanianAleutAlsatianAmericanApacheArabArapahoArgentineanArmenianAssyrian/Chaldean/SyriacAustralianAustrianBahamianBangladeshiBarbadianBasqueBelgianBelizeanBermudanBhutaneseBlackfeetBolivianBrazilianBritishBritish West IndianBulgarianBurmeseCajunCambodianCanadianCape VerdeanCarpatho RusynCelticCentral AmericanCentral American IndianCherokeeCheyenneChickasawChileanChineseChippewaChoctawColombianColvilleComancheCosta RicanCreeCreekCroatianCrowCubanCypriotCzechCzechoslovakianDanishDelawareDominicanDutchDutch West IndianEastern EuropeanEcuadorianEgyptianEnglishEstonianEthiopianEuropeanFijianFilipinoFinnishFrenchFrench American IndianFrench CanadianGermanGerman RussianGhanaianGuamanian/ChamorroGuatemalanGuyaneseHaitianHmongHonduranHopiHoumaHungarianIcelanderIndian (Asian)IndonesianInupiatIranianIraqiIrishIroquoisIsraeliItalianJamaicanJapaneseJordanianKenyanKiowaKoreanLaotianLatvianLebaneseLiberianLithuanianLumbeeLuxembourgerMacedonianMalaysianMalteseMarshalleseMenomineeMexicanMexican American IndianMongolianMoroccanNative HawaiianNavajoNepaleseNew ZealanderNicaraguanNigerianNorthern EuropeanNorwegianOkinawanOsageOttawaPaiutePakistaniPalestinianPanamanianParaguayanPennsylvania GermanPeruvianPimaPolishPortuguesePotawatomiPuebloPuerto RicanPuget Sound SalishRomanianRussianSalvadoranSamoanScandinavianScotch-IrishScottishSeminoleSenegaleseSerbianShoshoneSierra LeoneanSiouxSlavicSlovakSloveneSomaliSouth AfricanSouth AmericanSouth American IndianSoviet UnionSpaniardSpanishSpanish AmericanSpanish American IndianSri LankanSubsaharan AfricanSudaneseSwedishSwissSyrianTaiwaneseThaiTlingit-HaidaTohono O'OdhamTonganTrinidadian and TobagonianTsimshianTurkishU.S. Virgin IslanderUgandanUkrainianUruguayanUteVenezuelanVietnameseWelshWest IndianYakamaYaquiYugoslavianYumanYup'ikZimbabwean
Immigration
NonimmigrantsImmigrantsAfghanistanAfricaAlbaniaArgentinaArmeniaAsiaAustraliaAustriaBahamasBangladeshBarbadosBelarusBelgiumBelizeBoliviaBosnia and HerzegovinaBrazilBulgariaBurma/MyanmarCabo VerdeCambodiaCameroonCanadaCaribbeanCentral AmericaChileChinaColombiaCongoCosta RicaCroatiaCubaCzechoslovakiaDenmarkDominicaDominican RepublicEastern AfricaEastern AsiaEastern EuropeEcuadorEgyptEl SalvadorEnglandEritreaEthiopiaEuropeFijiFranceGermanyGhanaGreeceGrenadaGuatemalaGuyanaHaitiHondurasHong KongHungaryIndiaIndonesiaIranIraqIrelandIsraelItalyJamaicaJapanJordanKazakhstanKenyaKoreaKuwaitLaosLatin AmericaLatviaLebanonLiberiaLithuaniaMalaysiaMexicoMicronesiaMiddle AfricaMoldovaMoroccoNepalNetherlandsNicaraguaNigeriaNorth AmericaNorth MacedoniaNorthern AfricaNorthern EuropeNorwayOceaniaPakistanPanamaPeruPhilippinesPolandPortugalRomaniaRussiaSaudi ArabiaScotlandSenegalSerbiaSierra LeoneSingaporeSomaliaSouth AfricaSouth AmericaSouth Central AsiaSouth Eastern AsiaSouthern EuropeSpainSri LankaSt. Vincent and the GrenadinesSudanSwedenSwitzerlandSyriaTaiwanThailandTrinidad and TobagoTurkeyUgandaUkraineUruguayUzbekistanVenezuelaVietnamWest IndiesWestern AfricaWestern AsiaWestern EuropeYemenZaireZimbabweAzores
Male Poverty
Income
Poverty
Unemployment
Labor Participation
Family Structure
Vehicle Availability
Education Level
Disability

Male Poverty Comparison

Greeks

Immigrants from Sweden

Exceptional
Exceptional
9.7%
MALE POVERTY
99.6/ 100
METRIC RATING
29th/ 347
METRIC RANK
10.3%
MALE POVERTY
95.7/ 100
METRIC RATING
83rd/ 347
METRIC RANK

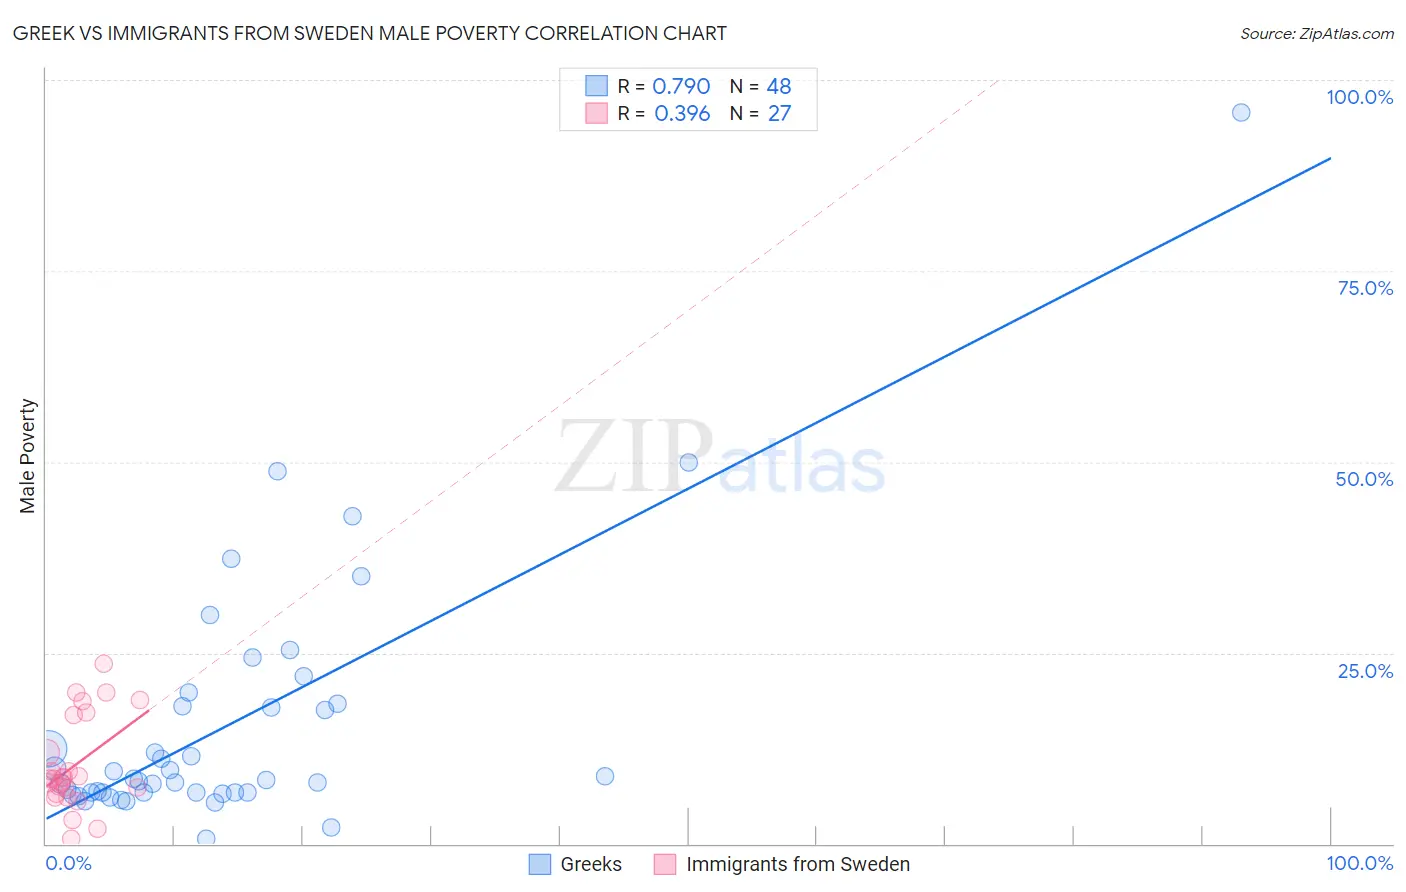
Greek vs Immigrants from Sweden Male Poverty Correlation Chart

The statistical analysis conducted on geographies consisting of 481,993,852 people shows a strong positive correlation between the proportion of Greeks and poverty level among males in the United States with a correlation coefficient (R) of 0.790 and weighted average of 9.7%. Similarly, the statistical analysis conducted on geographies consisting of 164,680,167 people shows a mild positive correlation between the proportion of Immigrants from Sweden and poverty level among males in the United States with a correlation coefficient (R) of 0.396 and weighted average of 10.3%, a difference of 6.5%.
Greek vs Immigrants from Sweden Male Poverty

Male Poverty Correlation Summary

MeasurementGreekImmigrants from Sweden
Minimum0.65%0.65%
Maximum95.7%23.6%
Range95.1%23.0%
Mean15.6%10.2%
Median8.4%8.6%
Interquartile 25% (IQ1)6.7%6.6%
Interquartile 75% (IQ3)18.1%16.8%
Interquartile Range (IQR)11.4%10.2%
Standard Deviation (Sample)16.7%6.0%
Standard Deviation (Population)16.5%5.9%

Similar Demographics by Male Poverty

Demographics Similar to Greeks by Male Poverty

In terms of male poverty, the demographic groups most similar to Greeks are Immigrants from Korea (9.7%, a difference of 0.040%), Polish (9.7%, a difference of 0.080%), Tongan (9.7%, a difference of 0.10%), Danish (9.7%, a difference of 0.12%), and Burmese (9.7%, a difference of 0.25%).
DemographicsRating | RankMale Poverty
Croatians
99.7
/100
|
#22
Exceptional
9.6%
Italians
99.7
/100
|
#23
Exceptional
9.6%
Swedes
99.7
/100
|
#24
Exceptional
9.6%
Eastern Europeans
99.6
/100
|
#25
Exceptional
9.6%
Burmese
99.6
/100
|
#26
Exceptional
9.7%
Danes
99.6
/100
|
#27
Exceptional
9.7%
Immigrants | Korea
99.6
/100
|
#28
Exceptional
9.7%
Greeks
99.6
/100
|
#29
Exceptional
9.7%
Poles
99.5
/100
|
#30
Exceptional
9.7%
Tongans
99.5
/100
|
#31
Exceptional
9.7%
Macedonians
99.5
/100
|
#32
Exceptional
9.7%
Immigrants | Northern Europe
99.5
/100
|
#33
Exceptional
9.7%
Immigrants | Poland
99.5
/100
|
#34
Exceptional
9.8%
Iranians
99.4
/100
|
#35
Exceptional
9.8%
Czechs
99.4
/100
|
#36
Exceptional
9.8%

Demographics Similar to Immigrants from Sweden by Male Poverty

In terms of male poverty, the demographic groups most similar to Immigrants from Sweden are Czechoslovakian (10.3%, a difference of 0.060%), Immigrants from England (10.4%, a difference of 0.11%), Egyptian (10.3%, a difference of 0.12%), Belgian (10.3%, a difference of 0.13%), and Immigrants from Eastern Asia (10.4%, a difference of 0.25%).
DemographicsRating | RankMale Poverty
Dutch
96.9
/100
|
#76
Exceptional
10.2%
Immigrants | Belgium
96.8
/100
|
#77
Exceptional
10.3%
Irish
96.8
/100
|
#78
Exceptional
10.3%
Immigrants | North America
96.5
/100
|
#79
Exceptional
10.3%
English
96.4
/100
|
#80
Exceptional
10.3%
Belgians
95.9
/100
|
#81
Exceptional
10.3%
Egyptians
95.9
/100
|
#82
Exceptional
10.3%
Immigrants | Sweden
95.7
/100
|
#83
Exceptional
10.3%
Czechoslovakians
95.6
/100
|
#84
Exceptional
10.3%
Immigrants | England
95.5
/100
|
#85
Exceptional
10.4%
Immigrants | Eastern Asia
95.3
/100
|
#86
Exceptional
10.4%
Northern Europeans
95.2
/100
|
#87
Exceptional
10.4%
Cambodians
95.0
/100
|
#88
Exceptional
10.4%
Immigrants | Denmark
95.0
/100
|
#89
Exceptional
10.4%
Indians (Asian)
94.9
/100
|
#90
Exceptional
10.4%