Immigrants from Burma/Myanmar vs Immigrants from Sweden Male Poverty
COMPARE
Immigrants from Burma/Myanmar
Immigrants from Sweden
Male Poverty
Male Poverty Comparison
Immigrants from Burma/Myanmar
Immigrants from Sweden
13.0%
MALE POVERTY
0.1/ 100
METRIC RATING
256th/ 347
METRIC RANK
10.3%
MALE POVERTY
95.7/ 100
METRIC RATING
83rd/ 347
METRIC RANK
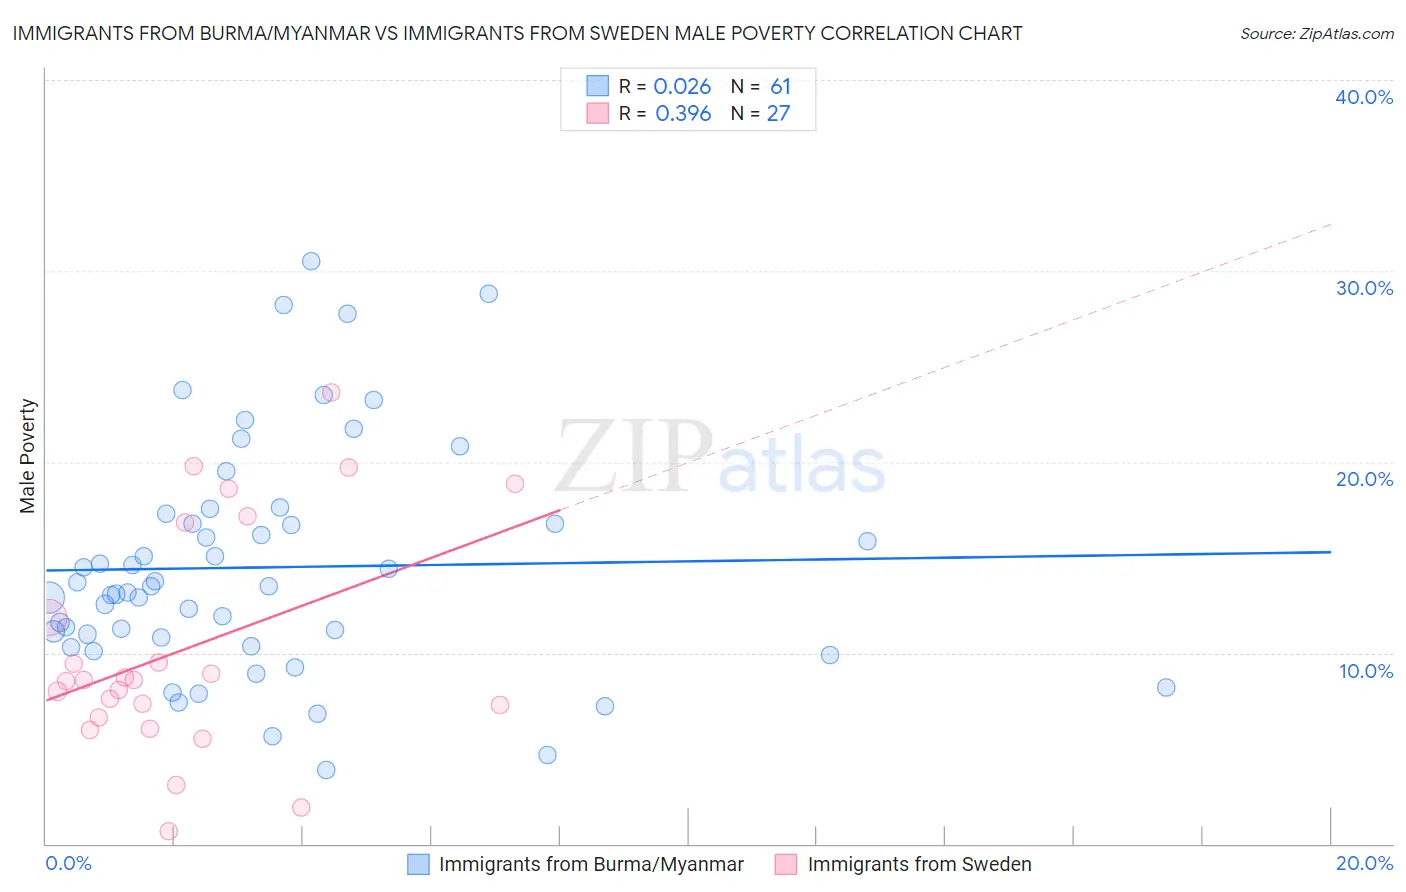
Immigrants from Burma/Myanmar vs Immigrants from Sweden Male Poverty Correlation Chart
The statistical analysis conducted on geographies consisting of 172,258,093 people shows no correlation between the proportion of Immigrants from Burma/Myanmar and poverty level among males in the United States with a correlation coefficient (R) of 0.026 and weighted average of 13.0%. Similarly, the statistical analysis conducted on geographies consisting of 164,680,167 people shows a mild positive correlation between the proportion of Immigrants from Sweden and poverty level among males in the United States with a correlation coefficient (R) of 0.396 and weighted average of 10.3%, a difference of 25.9%.
Male Poverty Correlation Summary
| Measurement | Immigrants from Burma/Myanmar | Immigrants from Sweden |
| Minimum | 3.9% | 0.65% |
| Maximum | 30.5% | 23.6% |
| Range | 26.6% | 23.0% |
| Mean | 14.5% | 10.2% |
| Median | 13.5% | 8.6% |
| Interquartile 25% (IQ1) | 10.6% | 6.6% |
| Interquartile 75% (IQ3) | 17.0% | 16.8% |
| Interquartile Range (IQR) | 6.5% | 10.2% |
| Standard Deviation (Sample) | 6.0% | 6.0% |
| Standard Deviation (Population) | 5.9% | 5.9% |
Similar Demographics by Male Poverty
Demographics Similar to Immigrants from Burma/Myanmar by Male Poverty
In terms of male poverty, the demographic groups most similar to Immigrants from Burma/Myanmar are Immigrants from Liberia (13.0%, a difference of 0.20%), Immigrants from Trinidad and Tobago (13.1%, a difference of 0.26%), Mexican American Indian (13.0%, a difference of 0.29%), Cape Verdean (13.1%, a difference of 0.39%), and Cherokee (13.1%, a difference of 0.55%).
| Demographics | Rating | Rank | Male Poverty |
| Potawatomi | 0.2 /100 | #249 | Tragic 12.9% |
| Immigrants | Nicaragua | 0.2 /100 | #250 | Tragic 12.9% |
| Immigrants | Cuba | 0.2 /100 | #251 | Tragic 12.9% |
| Immigrants | Ecuador | 0.2 /100 | #252 | Tragic 12.9% |
| Immigrants | Ghana | 0.2 /100 | #253 | Tragic 12.9% |
| Mexican American Indians | 0.1 /100 | #254 | Tragic 13.0% |
| Immigrants | Liberia | 0.1 /100 | #255 | Tragic 13.0% |
| Immigrants | Burma/Myanmar | 0.1 /100 | #256 | Tragic 13.0% |
| Immigrants | Trinidad and Tobago | 0.1 /100 | #257 | Tragic 13.1% |
| Cape Verdeans | 0.1 /100 | #258 | Tragic 13.1% |
| Cherokee | 0.1 /100 | #259 | Tragic 13.1% |
| Ottawa | 0.1 /100 | #260 | Tragic 13.1% |
| Trinidadians and Tobagonians | 0.1 /100 | #261 | Tragic 13.1% |
| Spanish American Indians | 0.1 /100 | #262 | Tragic 13.1% |
| Central Americans | 0.1 /100 | #263 | Tragic 13.2% |
Demographics Similar to Immigrants from Sweden by Male Poverty
In terms of male poverty, the demographic groups most similar to Immigrants from Sweden are Czechoslovakian (10.3%, a difference of 0.060%), Immigrants from England (10.4%, a difference of 0.11%), Egyptian (10.3%, a difference of 0.12%), Belgian (10.3%, a difference of 0.13%), and Immigrants from Eastern Asia (10.4%, a difference of 0.25%).
| Demographics | Rating | Rank | Male Poverty |
| Dutch | 96.9 /100 | #76 | Exceptional 10.2% |
| Immigrants | Belgium | 96.8 /100 | #77 | Exceptional 10.3% |
| Irish | 96.8 /100 | #78 | Exceptional 10.3% |
| Immigrants | North America | 96.5 /100 | #79 | Exceptional 10.3% |
| English | 96.4 /100 | #80 | Exceptional 10.3% |
| Belgians | 95.9 /100 | #81 | Exceptional 10.3% |
| Egyptians | 95.9 /100 | #82 | Exceptional 10.3% |
| Immigrants | Sweden | 95.7 /100 | #83 | Exceptional 10.3% |
| Czechoslovakians | 95.6 /100 | #84 | Exceptional 10.3% |
| Immigrants | England | 95.5 /100 | #85 | Exceptional 10.4% |
| Immigrants | Eastern Asia | 95.3 /100 | #86 | Exceptional 10.4% |
| Northern Europeans | 95.2 /100 | #87 | Exceptional 10.4% |
| Cambodians | 95.0 /100 | #88 | Exceptional 10.4% |
| Immigrants | Denmark | 95.0 /100 | #89 | Exceptional 10.4% |
| Indians (Asian) | 94.9 /100 | #90 | Exceptional 10.4% |