Turkish vs Immigrants from Sweden 11th Grade
COMPARE
Turkish
Immigrants from Sweden
11th Grade
11th Grade Comparison
Turks
Immigrants from Sweden
94.0%
11TH GRADE
99.9/ 100
METRIC RATING
51st/ 347
METRIC RANK
93.9%
11TH GRADE
99.8/ 100
METRIC RATING
64th/ 347
METRIC RANK
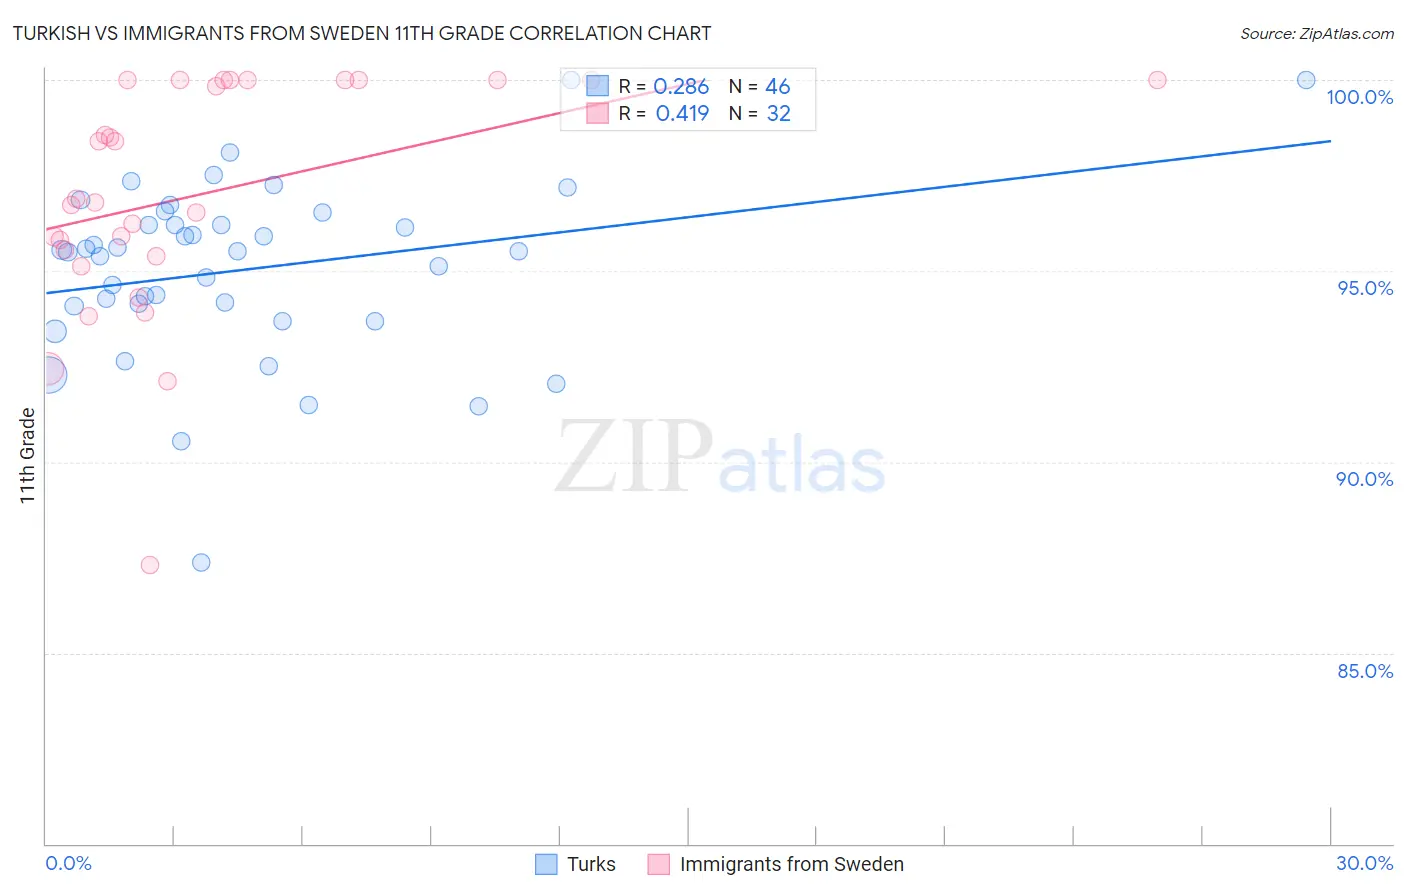
Turkish vs Immigrants from Sweden 11th Grade Correlation Chart
The statistical analysis conducted on geographies consisting of 271,864,104 people shows a weak positive correlation between the proportion of Turks and percentage of population with at least 11th grade education in the United States with a correlation coefficient (R) of 0.286 and weighted average of 94.0%. Similarly, the statistical analysis conducted on geographies consisting of 164,736,894 people shows a moderate positive correlation between the proportion of Immigrants from Sweden and percentage of population with at least 11th grade education in the United States with a correlation coefficient (R) of 0.419 and weighted average of 93.9%, a difference of 0.11%.
11th Grade Correlation Summary
| Measurement | Turkish | Immigrants from Sweden |
| Minimum | 87.4% | 87.3% |
| Maximum | 100.0% | 100.0% |
| Range | 12.6% | 12.7% |
| Mean | 95.0% | 97.0% |
| Median | 95.5% | 96.8% |
| Interquartile 25% (IQ1) | 94.1% | 95.5% |
| Interquartile 75% (IQ3) | 96.2% | 100.0% |
| Interquartile Range (IQR) | 2.1% | 4.5% |
| Standard Deviation (Sample) | 2.3% | 3.0% |
| Standard Deviation (Population) | 2.3% | 3.0% |
Demographics Similar to Turks and Immigrants from Sweden by 11th Grade
In terms of 11th grade, the demographic groups most similar to Turks are Immigrants from Canada (94.0%, a difference of 0.010%), Immigrants from Australia (94.0%, a difference of 0.020%), Filipino (94.1%, a difference of 0.030%), Macedonian (94.1%, a difference of 0.030%), and Slavic (94.1%, a difference of 0.030%). Similarly, the demographic groups most similar to Immigrants from Sweden are Native Hawaiian (93.9%, a difference of 0.0%), Alaskan Athabascan (93.9%, a difference of 0.020%), Immigrants from Netherlands (93.9%, a difference of 0.020%), Ukrainian (94.0%, a difference of 0.030%), and Immigrants from Belgium (94.0%, a difference of 0.050%).
| Demographics | Rating | Rank | 11th Grade |
| Filipinos | 99.9 /100 | #47 | Exceptional 94.1% |
| Macedonians | 99.9 /100 | #48 | Exceptional 94.1% |
| Slavs | 99.9 /100 | #49 | Exceptional 94.1% |
| French | 99.9 /100 | #50 | Exceptional 94.1% |
| Turks | 99.9 /100 | #51 | Exceptional 94.0% |
| Immigrants | Canada | 99.9 /100 | #52 | Exceptional 94.0% |
| Immigrants | Australia | 99.9 /100 | #53 | Exceptional 94.0% |
| Immigrants | North America | 99.9 /100 | #54 | Exceptional 94.0% |
| Czechoslovakians | 99.9 /100 | #55 | Exceptional 94.0% |
| French Canadians | 99.9 /100 | #56 | Exceptional 94.0% |
| New Zealanders | 99.9 /100 | #57 | Exceptional 94.0% |
| Iranians | 99.9 /100 | #58 | Exceptional 94.0% |
| Bhutanese | 99.8 /100 | #59 | Exceptional 94.0% |
| Okinawans | 99.8 /100 | #60 | Exceptional 94.0% |
| Immigrants | Belgium | 99.8 /100 | #61 | Exceptional 94.0% |
| Austrians | 99.8 /100 | #62 | Exceptional 94.0% |
| Ukrainians | 99.8 /100 | #63 | Exceptional 94.0% |
| Immigrants | Sweden | 99.8 /100 | #64 | Exceptional 93.9% |
| Native Hawaiians | 99.8 /100 | #65 | Exceptional 93.9% |
| Alaskan Athabascans | 99.8 /100 | #66 | Exceptional 93.9% |
| Immigrants | Netherlands | 99.8 /100 | #67 | Exceptional 93.9% |