Alsatian vs Immigrants from Sweden Male Poverty
COMPARE
Alsatian
Immigrants from Sweden
Male Poverty
Male Poverty Comparison
Alsatians
Immigrants from Sweden
12.4%
MALE POVERTY
1.3/ 100
METRIC RATING
228th/ 347
METRIC RANK
10.3%
MALE POVERTY
95.7/ 100
METRIC RATING
83rd/ 347
METRIC RANK
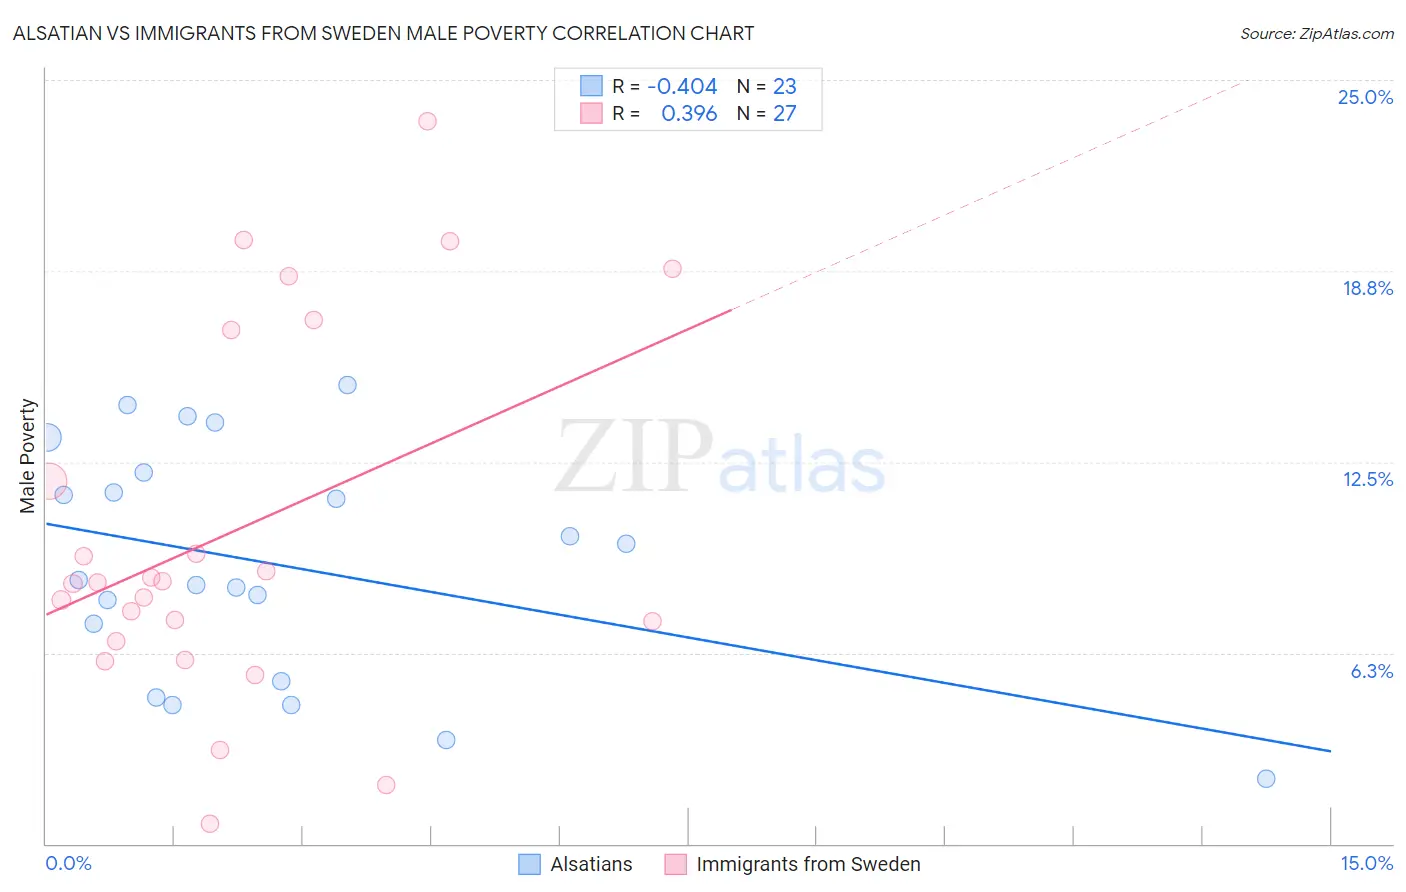
Alsatian vs Immigrants from Sweden Male Poverty Correlation Chart
The statistical analysis conducted on geographies consisting of 82,673,926 people shows a moderate negative correlation between the proportion of Alsatians and poverty level among males in the United States with a correlation coefficient (R) of -0.404 and weighted average of 12.4%. Similarly, the statistical analysis conducted on geographies consisting of 164,680,167 people shows a mild positive correlation between the proportion of Immigrants from Sweden and poverty level among males in the United States with a correlation coefficient (R) of 0.396 and weighted average of 10.3%, a difference of 19.6%.
Male Poverty Correlation Summary
| Measurement | Alsatian | Immigrants from Sweden |
| Minimum | 2.1% | 0.65% |
| Maximum | 15.0% | 23.6% |
| Range | 12.9% | 23.0% |
| Mean | 9.1% | 10.2% |
| Median | 8.6% | 8.6% |
| Interquartile 25% (IQ1) | 5.3% | 6.6% |
| Interquartile 75% (IQ3) | 12.2% | 16.8% |
| Interquartile Range (IQR) | 6.9% | 10.2% |
| Standard Deviation (Sample) | 3.8% | 6.0% |
| Standard Deviation (Population) | 3.7% | 5.9% |
Similar Demographics by Male Poverty
Demographics Similar to Alsatians by Male Poverty
In terms of male poverty, the demographic groups most similar to Alsatians are Alaska Native (12.4%, a difference of 0.040%), Cuban (12.4%, a difference of 0.090%), Nigerian (12.3%, a difference of 0.13%), Osage (12.3%, a difference of 0.30%), and Immigrants from Nigeria (12.3%, a difference of 0.36%).
| Demographics | Rating | Rank | Male Poverty |
| Ugandans | 2.2 /100 | #221 | Tragic 12.2% |
| Immigrants | Africa | 2.1 /100 | #222 | Tragic 12.2% |
| Immigrants | Micronesia | 2.1 /100 | #223 | Tragic 12.2% |
| Immigrants | Nigeria | 1.6 /100 | #224 | Tragic 12.3% |
| Osage | 1.5 /100 | #225 | Tragic 12.3% |
| Nigerians | 1.4 /100 | #226 | Tragic 12.3% |
| Alaska Natives | 1.4 /100 | #227 | Tragic 12.4% |
| Alsatians | 1.3 /100 | #228 | Tragic 12.4% |
| Cubans | 1.3 /100 | #229 | Tragic 12.4% |
| Marshallese | 0.8 /100 | #230 | Tragic 12.5% |
| Salvadorans | 0.6 /100 | #231 | Tragic 12.6% |
| Nicaraguans | 0.6 /100 | #232 | Tragic 12.6% |
| Fijians | 0.6 /100 | #233 | Tragic 12.6% |
| Immigrants | Armenia | 0.6 /100 | #234 | Tragic 12.6% |
| Immigrants | Laos | 0.5 /100 | #235 | Tragic 12.6% |
Demographics Similar to Immigrants from Sweden by Male Poverty
In terms of male poverty, the demographic groups most similar to Immigrants from Sweden are Czechoslovakian (10.3%, a difference of 0.060%), Immigrants from England (10.4%, a difference of 0.11%), Egyptian (10.3%, a difference of 0.12%), Belgian (10.3%, a difference of 0.13%), and Immigrants from Eastern Asia (10.4%, a difference of 0.25%).
| Demographics | Rating | Rank | Male Poverty |
| Dutch | 96.9 /100 | #76 | Exceptional 10.2% |
| Immigrants | Belgium | 96.8 /100 | #77 | Exceptional 10.3% |
| Irish | 96.8 /100 | #78 | Exceptional 10.3% |
| Immigrants | North America | 96.5 /100 | #79 | Exceptional 10.3% |
| English | 96.4 /100 | #80 | Exceptional 10.3% |
| Belgians | 95.9 /100 | #81 | Exceptional 10.3% |
| Egyptians | 95.9 /100 | #82 | Exceptional 10.3% |
| Immigrants | Sweden | 95.7 /100 | #83 | Exceptional 10.3% |
| Czechoslovakians | 95.6 /100 | #84 | Exceptional 10.3% |
| Immigrants | England | 95.5 /100 | #85 | Exceptional 10.4% |
| Immigrants | Eastern Asia | 95.3 /100 | #86 | Exceptional 10.4% |
| Northern Europeans | 95.2 /100 | #87 | Exceptional 10.4% |
| Cambodians | 95.0 /100 | #88 | Exceptional 10.4% |
| Immigrants | Denmark | 95.0 /100 | #89 | Exceptional 10.4% |
| Indians (Asian) | 94.9 /100 | #90 | Exceptional 10.4% |