Immigrants from Morocco vs Chinese Single Mother Poverty

COMPARE

Immigrants from Morocco
Race
Ancestry
AfghanAfricanAlaska NativeAlaskan AthabascanAlbanianAleutAlsatianAmericanApacheArabArapahoArgentineanArmenianAssyrian/Chaldean/SyriacAustralianAustrianBahamianBangladeshiBarbadianBasqueBelgianBelizeanBermudanBhutaneseBlackfeetBolivianBrazilianBritishBritish West IndianBulgarianBurmeseCajunCambodianCanadianCape VerdeanCarpatho RusynCelticCentral AmericanCentral American IndianCherokeeCheyenneChickasawChileanChippewaChoctawColombianColvilleComancheCosta RicanCreeCreekCroatianCrowCubanCypriotCzechCzechoslovakianDanishDelawareDominicanDutchDutch West IndianEastern EuropeanEcuadorianEgyptianEnglishEstonianEthiopianEuropeanFijianFilipinoFinnishFrenchFrench American IndianFrench CanadianGermanGerman RussianGhanaianGreekGuamanian/ChamorroGuatemalanGuyaneseHaitianHmongHonduranHopiHoumaHungarianIcelanderIndian (Asian)IndonesianInupiatIranianIraqiIrishIroquoisIsraeliItalianJamaicanJapaneseJordanianKenyanKiowaKoreanLaotianLatvianLebaneseLiberianLithuanianLumbeeLuxembourgerMacedonianMalaysianMalteseMarshalleseMenomineeMexicanMexican American IndianMongolianMoroccanNative HawaiianNavajoNepaleseNew ZealanderNicaraguanNigerianNorthern EuropeanNorwegianOkinawanOsageOttawaPaiutePakistaniPalestinianPanamanianParaguayanPennsylvania GermanPeruvianPimaPolishPortuguesePotawatomiPuebloPuerto RicanPuget Sound SalishRomanianRussianSalvadoranSamoanScandinavianScotch-IrishScottishSeminoleSenegaleseSerbianShoshoneSierra LeoneanSiouxSlavicSlovakSloveneSomaliSouth AfricanSouth AmericanSouth American IndianSoviet UnionSpaniardSpanishSpanish AmericanSpanish American IndianSri LankanSubsaharan AfricanSudaneseSwedishSwissSyrianTaiwaneseThaiTlingit-HaidaTohono O'OdhamTonganTrinidadian and TobagonianTsimshianTurkishU.S. Virgin IslanderUgandanUkrainianUruguayanUteVenezuelanVietnameseWelshWest IndianYakamaYaquiYugoslavianYumanYup'ikZimbabwean
Immigration
NonimmigrantsImmigrantsAfghanistanAfricaAlbaniaArgentinaArmeniaAsiaAustraliaAustriaBahamasBangladeshBarbadosBelarusBelgiumBelizeBoliviaBosnia and HerzegovinaBrazilBulgariaBurma/MyanmarCabo VerdeCambodiaCameroonCanadaCaribbeanCentral AmericaChileChinaColombiaCongoCosta RicaCroatiaCubaCzechoslovakiaDenmarkDominicaDominican RepublicEastern AfricaEastern AsiaEastern EuropeEcuadorEgyptEl SalvadorEnglandEritreaEthiopiaEuropeFijiFranceGermanyGhanaGreeceGrenadaGuatemalaGuyanaHaitiHondurasHong KongHungaryIndiaIndonesiaIranIraqIrelandIsraelItalyJamaicaJapanJordanKazakhstanKenyaKoreaKuwaitLaosLatin AmericaLatviaLebanonLiberiaLithuaniaMalaysiaMexicoMicronesiaMiddle AfricaMoldovaMoroccoNepalNetherlandsNicaraguaNigeriaNorth AmericaNorth MacedoniaNorthern AfricaNorthern EuropeNorwayOceaniaPakistanPanamaPeruPhilippinesPolandPortugalRomaniaRussiaSaudi ArabiaScotlandSenegalSerbiaSierra LeoneSingaporeSomaliaSouth AfricaSouth AmericaSouth Central AsiaSouth Eastern AsiaSouthern EuropeSpainSri LankaSt. Vincent and the GrenadinesSudanSwedenSwitzerlandSyriaTaiwanThailandTrinidad and TobagoTurkeyUgandaUkraineUruguayUzbekistanVenezuelaVietnamWest IndiesWestern AfricaWestern AsiaWestern EuropeYemenZaireZimbabweAzores
Chinese
Race
Ancestry
AfghanAfricanAlaska NativeAlaskan AthabascanAlbanianAleutAlsatianAmericanApacheArabArapahoArgentineanArmenianAssyrian/Chaldean/SyriacAustralianAustrianBahamianBangladeshiBarbadianBasqueBelgianBelizeanBermudanBhutaneseBlackfeetBolivianBrazilianBritishBritish West IndianBulgarianBurmeseCajunCambodianCanadianCape VerdeanCarpatho RusynCelticCentral AmericanCentral American IndianCherokeeCheyenneChickasawChileanChineseChippewaChoctawColombianColvilleComancheCosta RicanCreeCreekCroatianCrowCubanCypriotCzechCzechoslovakianDanishDelawareDominicanDutchDutch West IndianEastern EuropeanEcuadorianEgyptianEnglishEstonianEthiopianEuropeanFijianFilipinoFinnishFrenchFrench American IndianFrench CanadianGermanGerman RussianGhanaianGreekGuamanian/ChamorroGuatemalanGuyaneseHaitianHmongHonduranHopiHoumaHungarianIcelanderIndian (Asian)IndonesianInupiatIranianIraqiIrishIroquoisIsraeliItalianJamaicanJapaneseJordanianKenyanKiowaKoreanLaotianLatvianLebaneseLiberianLithuanianLumbeeLuxembourgerMacedonianMalaysianMalteseMarshalleseMenomineeMexicanMexican American IndianMongolianMoroccanNative HawaiianNavajoNepaleseNew ZealanderNicaraguanNigerianNorthern EuropeanNorwegianOkinawanOsageOttawaPaiutePakistaniPalestinianPanamanianParaguayanPennsylvania GermanPeruvianPimaPolishPortuguesePotawatomiPuebloPuerto RicanPuget Sound SalishRomanianRussianSalvadoranSamoanScandinavianScotch-IrishScottishSeminoleSenegaleseSerbianShoshoneSierra LeoneanSiouxSlavicSlovakSloveneSomaliSouth AfricanSouth AmericanSouth American IndianSoviet UnionSpaniardSpanishSpanish AmericanSpanish American IndianSri LankanSubsaharan AfricanSudaneseSwedishSwissSyrianTaiwaneseThaiTlingit-HaidaTohono O'OdhamTonganTrinidadian and TobagonianTsimshianTurkishU.S. Virgin IslanderUgandanUkrainianUruguayanUteVenezuelanVietnameseWelshWest IndianYakamaYaquiYugoslavianYumanYup'ikZimbabwean
Immigration
NonimmigrantsImmigrantsAfghanistanAfricaAlbaniaArgentinaArmeniaAsiaAustraliaAustriaBahamasBangladeshBarbadosBelarusBelgiumBelizeBoliviaBosnia and HerzegovinaBrazilBulgariaBurma/MyanmarCabo VerdeCambodiaCameroonCanadaCaribbeanCentral AmericaChileChinaColombiaCongoCosta RicaCroatiaCubaCzechoslovakiaDenmarkDominicaDominican RepublicEastern AfricaEastern AsiaEastern EuropeEcuadorEgyptEl SalvadorEnglandEritreaEthiopiaEuropeFijiFranceGermanyGhanaGreeceGrenadaGuatemalaGuyanaHaitiHondurasHong KongHungaryIndiaIndonesiaIranIraqIrelandIsraelItalyJamaicaJapanJordanKazakhstanKenyaKoreaKuwaitLaosLatin AmericaLatviaLebanonLiberiaLithuaniaMalaysiaMexicoMicronesiaMiddle AfricaMoldovaNepalNetherlandsNicaraguaNigeriaNorth AmericaNorth MacedoniaNorthern AfricaNorthern EuropeNorwayOceaniaPakistanPanamaPeruPhilippinesPolandPortugalRomaniaRussiaSaudi ArabiaScotlandSenegalSerbiaSierra LeoneSingaporeSomaliaSouth AfricaSouth AmericaSouth Central AsiaSouth Eastern AsiaSouthern EuropeSpainSri LankaSt. Vincent and the GrenadinesSudanSwedenSwitzerlandSyriaTaiwanThailandTrinidad and TobagoTurkeyUgandaUkraineUruguayUzbekistanVenezuelaVietnamWest IndiesWestern AfricaWestern AsiaWestern EuropeYemenZaireZimbabweAzores
Single Mother Poverty
Income
Poverty
Unemployment
Labor Participation
Family Structure
Vehicle Availability
Education Level
Disability

Single Mother Poverty Comparison

Immigrants from Morocco

Chinese

Excellent
Exceptional
28.4%
SINGLE MOTHER POVERTY
89.5/ 100
METRIC RATING
132nd/ 347
METRIC RANK
24.6%
SINGLE MOTHER POVERTY
100.0/ 100
METRIC RATING
7th/ 347
METRIC RANK

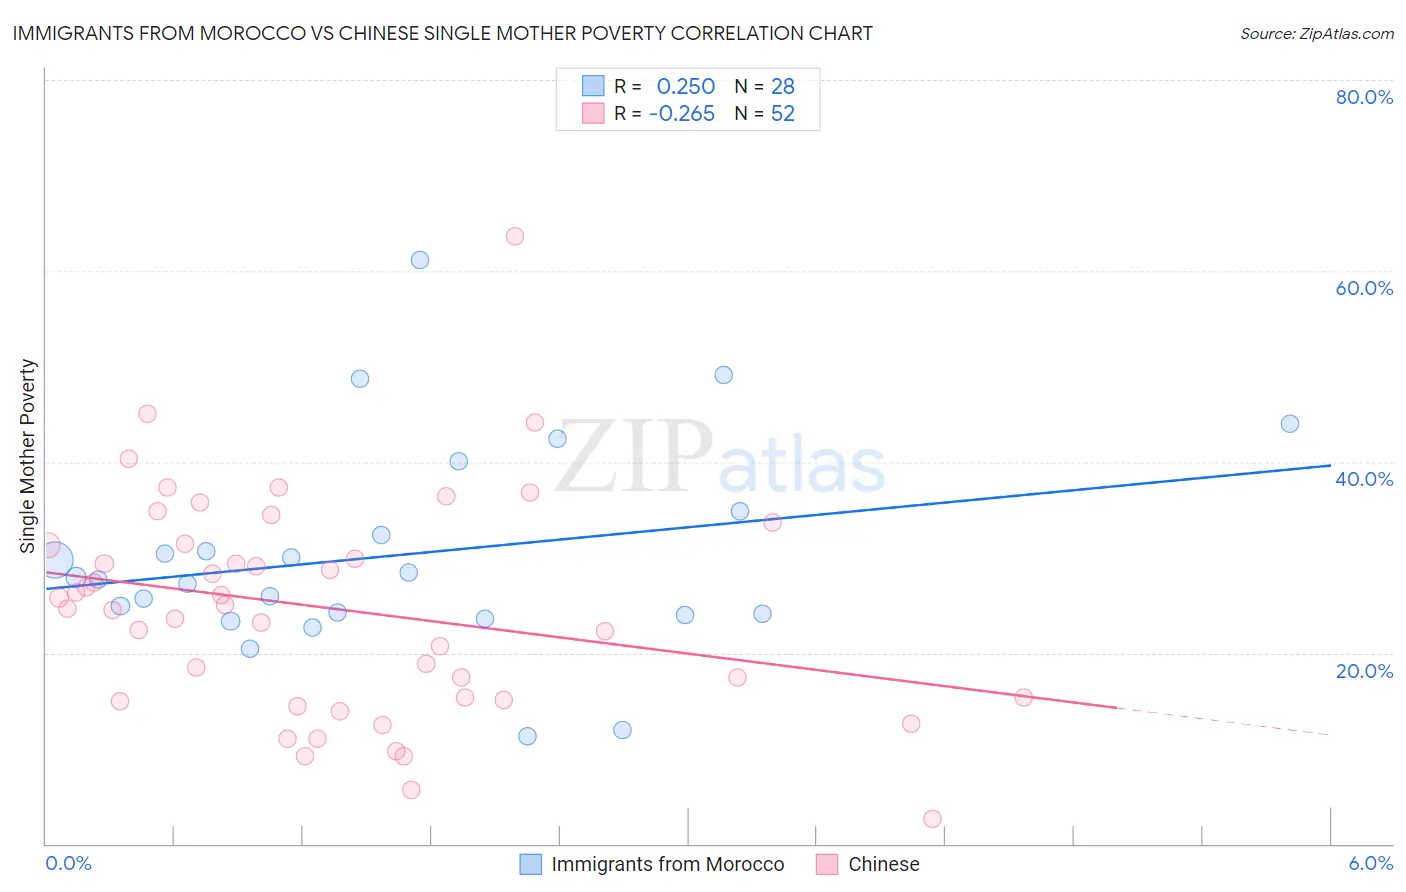
Immigrants from Morocco vs Chinese Single Mother Poverty Correlation Chart

The statistical analysis conducted on geographies consisting of 176,937,771 people shows a weak positive correlation between the proportion of Immigrants from Morocco and poverty level among single mothers in the United States with a correlation coefficient (R) of 0.250 and weighted average of 28.4%. Similarly, the statistical analysis conducted on geographies consisting of 64,411,570 people shows a weak negative correlation between the proportion of Chinese and poverty level among single mothers in the United States with a correlation coefficient (R) of -0.265 and weighted average of 24.6%, a difference of 15.4%.
Immigrants from Morocco vs Chinese Single Mother Poverty

Single Mother Poverty Correlation Summary

MeasurementImmigrants from MoroccoChinese
Minimum11.2%2.6%
Maximum61.2%63.6%
Range49.9%61.1%
Mean30.2%24.6%
Median27.8%24.8%
Interquartile 25% (IQ1)24.0%15.2%
Interquartile 75% (IQ3)33.6%31.4%
Interquartile Range (IQR)9.6%16.2%
Standard Deviation (Sample)11.0%11.6%
Standard Deviation (Population)10.8%11.4%

Similar Demographics by Single Mother Poverty

Demographics Similar to Immigrants from Morocco by Single Mother Poverty

In terms of single mother poverty, the demographic groups most similar to Immigrants from Morocco are Swedish (28.4%, a difference of 0.0%), Immigrants from Southern Europe (28.4%, a difference of 0.030%), Immigrants from Spain (28.4%, a difference of 0.030%), Native Hawaiian (28.4%, a difference of 0.070%), and Immigrants from Canada (28.4%, a difference of 0.070%).
DemographicsRating | RankSingle Mother Poverty
Kenyans
90.9
/100
|
#125
Exceptional
28.4%
Immigrants | Chile
90.8
/100
|
#126
Exceptional
28.4%
Poles
90.8
/100
|
#127
Exceptional
28.4%
Immigrants | England
90.5
/100
|
#128
Exceptional
28.4%
South Americans
90.4
/100
|
#129
Exceptional
28.4%
Norwegians
90.4
/100
|
#130
Exceptional
28.4%
Immigrants | Austria
90.3
/100
|
#131
Exceptional
28.4%
Immigrants | Morocco
89.5
/100
|
#132
Excellent
28.4%
Swedes
89.4
/100
|
#133
Excellent
28.4%
Immigrants | Southern Europe
89.2
/100
|
#134
Excellent
28.4%
Immigrants | Spain
89.2
/100
|
#135
Excellent
28.4%
Native Hawaiians
88.9
/100
|
#136
Excellent
28.4%
Immigrants | Canada
88.9
/100
|
#137
Excellent
28.4%
Immigrants | Belgium
88.5
/100
|
#138
Excellent
28.5%
Samoans
88.1
/100
|
#139
Excellent
28.5%

Demographics Similar to Chinese by Single Mother Poverty

In terms of single mother poverty, the demographic groups most similar to Chinese are Thai (24.5%, a difference of 0.54%), Immigrants from Hong Kong (24.4%, a difference of 1.0%), Filipino (24.3%, a difference of 1.3%), Immigrants from Iran (25.1%, a difference of 2.0%), and Immigrants from Lithuania (25.2%, a difference of 2.4%).
DemographicsRating | RankSingle Mother Poverty
Assyrians/Chaldeans/Syriacs
100.0
/100
|
#1
Exceptional
23.8%
Immigrants | India
100.0
/100
|
#2
Exceptional
23.8%
Immigrants | Taiwan
100.0
/100
|
#3
Exceptional
23.9%
Filipinos
100.0
/100
|
#4
Exceptional
24.3%
Immigrants | Hong Kong
100.0
/100
|
#5
Exceptional
24.4%
Thais
100.0
/100
|
#6
Exceptional
24.5%
Chinese
100.0
/100
|
#7
Exceptional
24.6%
Immigrants | Iran
100.0
/100
|
#8
Exceptional
25.1%
Immigrants | Lithuania
100.0
/100
|
#9
Exceptional
25.2%
Immigrants | South Central Asia
100.0
/100
|
#10
Exceptional
25.3%
Iranians
100.0
/100
|
#11
Exceptional
25.5%
Bhutanese
100.0
/100
|
#12
Exceptional
25.6%
Indians (Asian)
100.0
/100
|
#13
Exceptional
25.8%
Immigrants | Singapore
100.0
/100
|
#14
Exceptional
25.8%
Immigrants | Ireland
100.0
/100
|
#15
Exceptional
25.8%