Salvadoran vs Chinese Single Mother Poverty
COMPARE
Salvadoran
Chinese
Single Mother Poverty
Single Mother Poverty Comparison
Salvadorans
Chinese
30.6%
SINGLE MOTHER POVERTY
1.8/ 100
METRIC RATING
240th/ 347
METRIC RANK
24.6%
SINGLE MOTHER POVERTY
100.0/ 100
METRIC RATING
7th/ 347
METRIC RANK
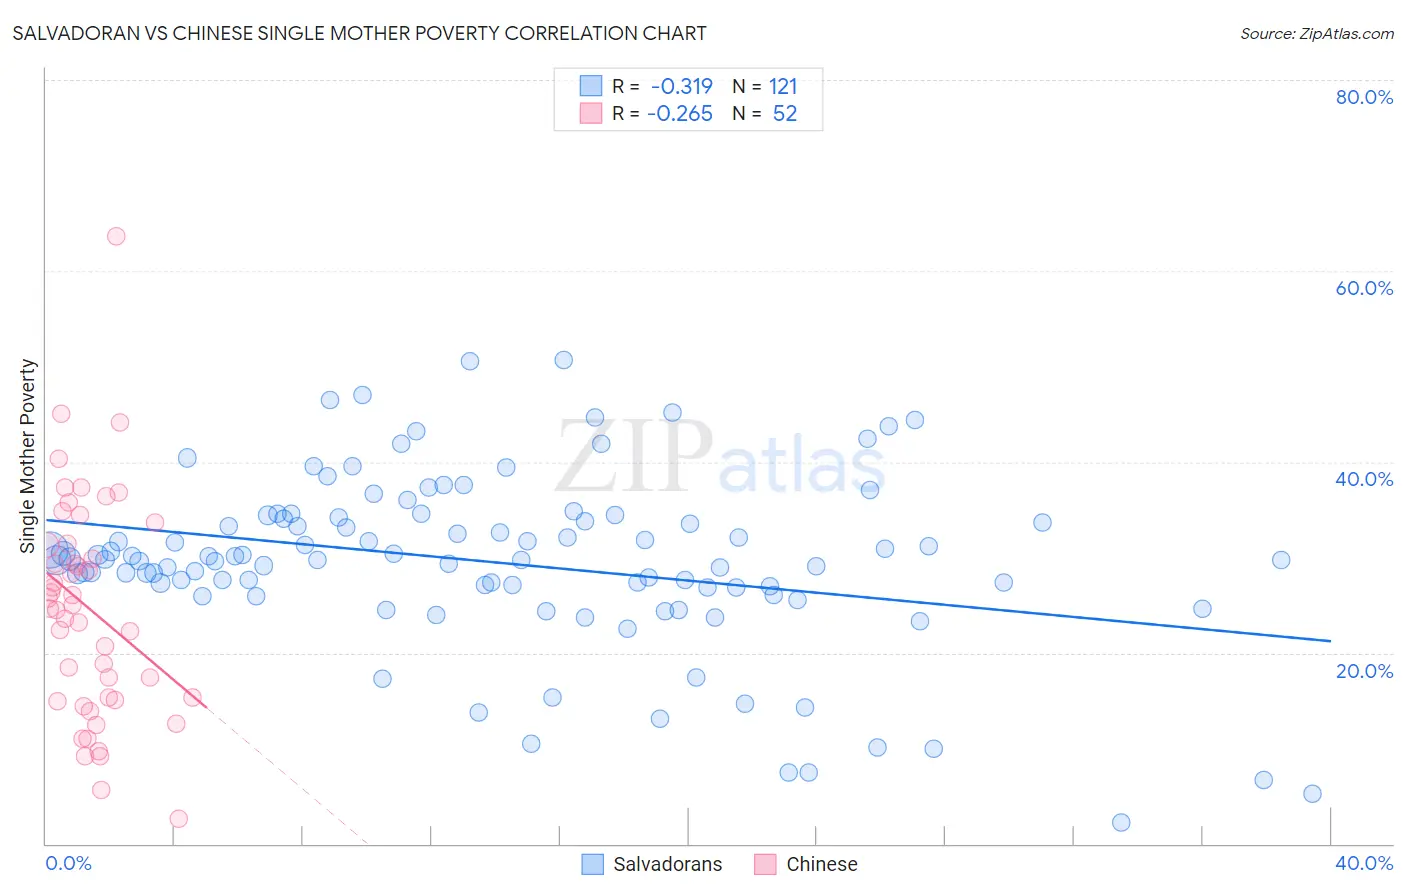
Salvadoran vs Chinese Single Mother Poverty Correlation Chart
The statistical analysis conducted on geographies consisting of 391,766,529 people shows a mild negative correlation between the proportion of Salvadorans and poverty level among single mothers in the United States with a correlation coefficient (R) of -0.319 and weighted average of 30.6%. Similarly, the statistical analysis conducted on geographies consisting of 64,411,570 people shows a weak negative correlation between the proportion of Chinese and poverty level among single mothers in the United States with a correlation coefficient (R) of -0.265 and weighted average of 24.6%, a difference of 24.1%.
Single Mother Poverty Correlation Summary
| Measurement | Salvadoran | Chinese |
| Minimum | 2.2% | 2.6% |
| Maximum | 50.7% | 63.6% |
| Range | 48.5% | 61.1% |
| Mean | 29.5% | 24.6% |
| Median | 29.8% | 24.8% |
| Interquartile 25% (IQ1) | 26.8% | 15.2% |
| Interquartile 75% (IQ3) | 34.2% | 31.4% |
| Interquartile Range (IQR) | 7.3% | 16.2% |
| Standard Deviation (Sample) | 9.2% | 11.6% |
| Standard Deviation (Population) | 9.1% | 11.4% |
Similar Demographics by Single Mother Poverty
Demographics Similar to Salvadorans by Single Mother Poverty
In terms of single mother poverty, the demographic groups most similar to Salvadorans are Immigrants from Laos (30.6%, a difference of 0.050%), Immigrants from Burma/Myanmar (30.6%, a difference of 0.070%), Immigrants from Portugal (30.5%, a difference of 0.13%), Bermudan (30.6%, a difference of 0.15%), and French (30.7%, a difference of 0.37%).
| Demographics | Rating | Rank | Single Mother Poverty |
| Immigrants | Middle Africa | 3.5 /100 | #233 | Tragic 30.3% |
| Immigrants | Nicaragua | 3.5 /100 | #234 | Tragic 30.3% |
| Immigrants | Grenada | 3.4 /100 | #235 | Tragic 30.3% |
| Welsh | 3.2 /100 | #236 | Tragic 30.4% |
| Immigrants | St. Vincent and the Grenadines | 3.1 /100 | #237 | Tragic 30.4% |
| Slovaks | 2.8 /100 | #238 | Tragic 30.4% |
| Immigrants | Portugal | 2.1 /100 | #239 | Tragic 30.5% |
| Salvadorans | 1.8 /100 | #240 | Tragic 30.6% |
| Immigrants | Laos | 1.8 /100 | #241 | Tragic 30.6% |
| Immigrants | Burma/Myanmar | 1.7 /100 | #242 | Tragic 30.6% |
| Bermudans | 1.6 /100 | #243 | Tragic 30.6% |
| French | 1.3 /100 | #244 | Tragic 30.7% |
| Barbadians | 1.3 /100 | #245 | Tragic 30.7% |
| Ecuadorians | 0.9 /100 | #246 | Tragic 30.8% |
| West Indians | 0.9 /100 | #247 | Tragic 30.8% |
Demographics Similar to Chinese by Single Mother Poverty
In terms of single mother poverty, the demographic groups most similar to Chinese are Thai (24.5%, a difference of 0.54%), Immigrants from Hong Kong (24.4%, a difference of 1.0%), Filipino (24.3%, a difference of 1.3%), Immigrants from Iran (25.1%, a difference of 2.0%), and Immigrants from Lithuania (25.2%, a difference of 2.4%).
| Demographics | Rating | Rank | Single Mother Poverty |
| Assyrians/Chaldeans/Syriacs | 100.0 /100 | #1 | Exceptional 23.8% |
| Immigrants | India | 100.0 /100 | #2 | Exceptional 23.8% |
| Immigrants | Taiwan | 100.0 /100 | #3 | Exceptional 23.9% |
| Filipinos | 100.0 /100 | #4 | Exceptional 24.3% |
| Immigrants | Hong Kong | 100.0 /100 | #5 | Exceptional 24.4% |
| Thais | 100.0 /100 | #6 | Exceptional 24.5% |
| Chinese | 100.0 /100 | #7 | Exceptional 24.6% |
| Immigrants | Iran | 100.0 /100 | #8 | Exceptional 25.1% |
| Immigrants | Lithuania | 100.0 /100 | #9 | Exceptional 25.2% |
| Immigrants | South Central Asia | 100.0 /100 | #10 | Exceptional 25.3% |
| Iranians | 100.0 /100 | #11 | Exceptional 25.5% |
| Bhutanese | 100.0 /100 | #12 | Exceptional 25.6% |
| Indians (Asian) | 100.0 /100 | #13 | Exceptional 25.8% |
| Immigrants | Singapore | 100.0 /100 | #14 | Exceptional 25.8% |
| Immigrants | Ireland | 100.0 /100 | #15 | Exceptional 25.8% |