Venezuelan vs Immigrants from Lithuania Male Poverty
COMPARE
Venezuelan
Immigrants from Lithuania
Male Poverty
Male Poverty Comparison
Venezuelans
Immigrants from Lithuania
11.0%
MALE POVERTY
67.4/ 100
METRIC RATING
151st/ 347
METRIC RANK
9.4%
MALE POVERTY
99.9/ 100
METRIC RATING
13th/ 347
METRIC RANK
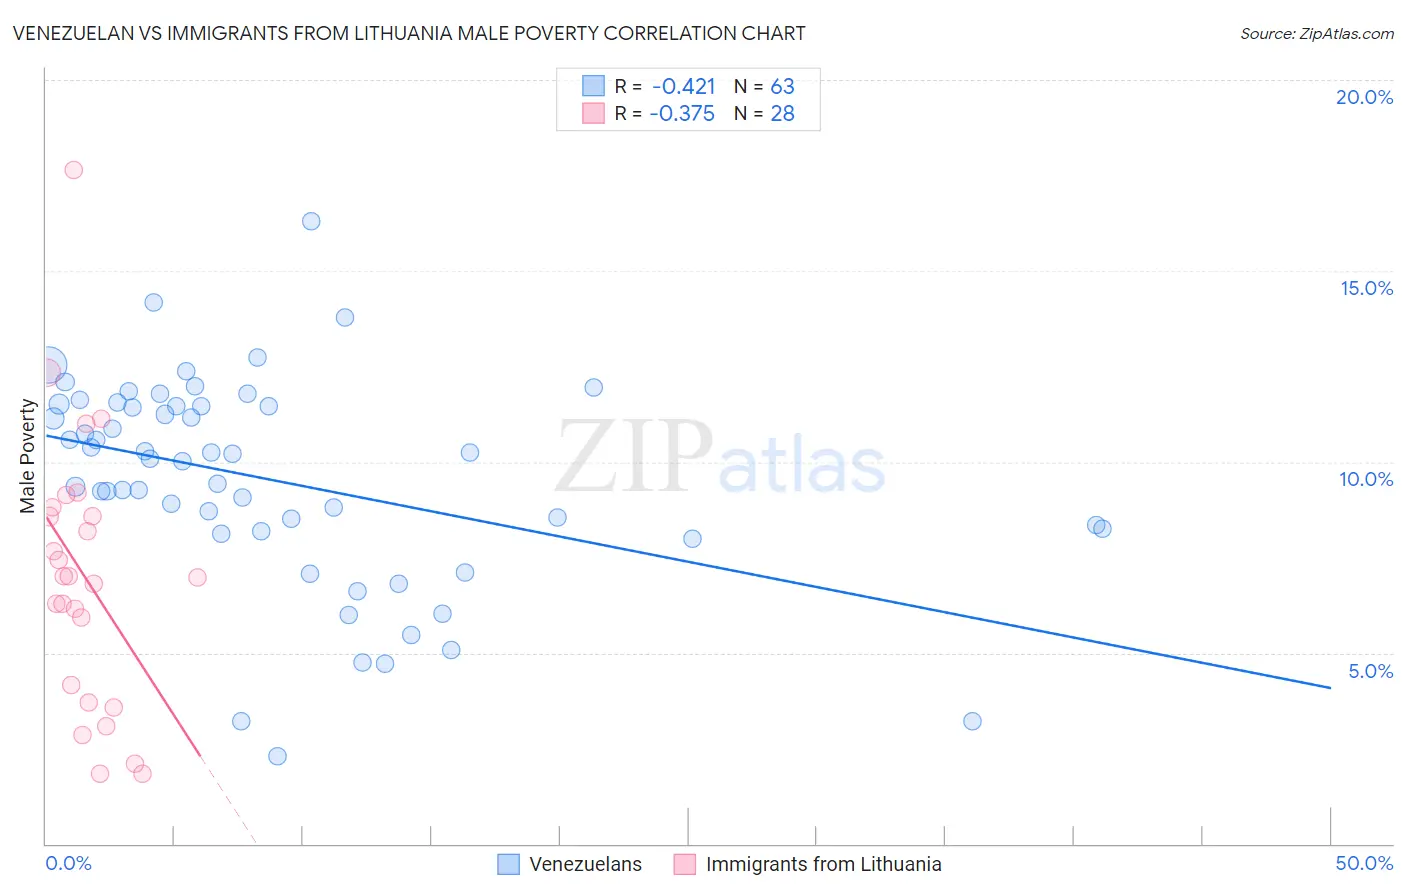
Venezuelan vs Immigrants from Lithuania Male Poverty Correlation Chart
The statistical analysis conducted on geographies consisting of 305,957,955 people shows a moderate negative correlation between the proportion of Venezuelans and poverty level among males in the United States with a correlation coefficient (R) of -0.421 and weighted average of 11.0%. Similarly, the statistical analysis conducted on geographies consisting of 117,705,146 people shows a mild negative correlation between the proportion of Immigrants from Lithuania and poverty level among males in the United States with a correlation coefficient (R) of -0.375 and weighted average of 9.4%, a difference of 16.9%.
Male Poverty Correlation Summary
| Measurement | Venezuelan | Immigrants from Lithuania |
| Minimum | 2.3% | 1.8% |
| Maximum | 16.3% | 17.6% |
| Range | 14.0% | 15.8% |
| Mean | 9.5% | 7.0% |
| Median | 10.1% | 7.0% |
| Interquartile 25% (IQ1) | 8.2% | 3.9% |
| Interquartile 75% (IQ3) | 11.5% | 8.7% |
| Interquartile Range (IQR) | 3.3% | 4.8% |
| Standard Deviation (Sample) | 2.8% | 3.5% |
| Standard Deviation (Population) | 2.7% | 3.5% |
Similar Demographics by Male Poverty
Demographics Similar to Venezuelans by Male Poverty
In terms of male poverty, the demographic groups most similar to Venezuelans are Immigrants from Nepal (11.0%, a difference of 0.0%), Guamanian/Chamorro (11.0%, a difference of 0.020%), Immigrants from Venezuela (11.0%, a difference of 0.060%), Armenian (11.0%, a difference of 0.080%), and Icelander (11.0%, a difference of 0.13%).
| Demographics | Rating | Rank | Male Poverty |
| Samoans | 71.8 /100 | #144 | Good 10.9% |
| Immigrants | Germany | 71.6 /100 | #145 | Good 10.9% |
| Syrians | 71.4 /100 | #146 | Good 10.9% |
| Icelanders | 68.5 /100 | #147 | Good 11.0% |
| Armenians | 68.0 /100 | #148 | Good 11.0% |
| Immigrants | Venezuela | 67.9 /100 | #149 | Good 11.0% |
| Guamanians/Chamorros | 67.6 /100 | #150 | Good 11.0% |
| Venezuelans | 67.4 /100 | #151 | Good 11.0% |
| Immigrants | Nepal | 67.3 /100 | #152 | Good 11.0% |
| Immigrants | Bosnia and Herzegovina | 65.2 /100 | #153 | Good 11.0% |
| Immigrants | Kazakhstan | 64.8 /100 | #154 | Good 11.0% |
| Immigrants | Malaysia | 64.7 /100 | #155 | Good 11.0% |
| Costa Ricans | 63.9 /100 | #156 | Good 11.0% |
| Scotch-Irish | 63.7 /100 | #157 | Good 11.0% |
| Colombians | 63.0 /100 | #158 | Good 11.0% |
Demographics Similar to Immigrants from Lithuania by Male Poverty
In terms of male poverty, the demographic groups most similar to Immigrants from Lithuania are Immigrants from Bolivia (9.4%, a difference of 0.12%), Bolivian (9.4%, a difference of 0.17%), Immigrants from North Macedonia (9.4%, a difference of 0.38%), Bhutanese (9.5%, a difference of 0.67%), and Bulgarian (9.3%, a difference of 0.82%).
| Demographics | Rating | Rank | Male Poverty |
| Assyrians/Chaldeans/Syriacs | 99.9 /100 | #6 | Exceptional 9.1% |
| Immigrants | Ireland | 99.9 /100 | #7 | Exceptional 9.1% |
| Filipinos | 99.9 /100 | #8 | Exceptional 9.2% |
| Immigrants | South Central Asia | 99.9 /100 | #9 | Exceptional 9.3% |
| Bulgarians | 99.9 /100 | #10 | Exceptional 9.3% |
| Bolivians | 99.9 /100 | #11 | Exceptional 9.4% |
| Immigrants | Bolivia | 99.9 /100 | #12 | Exceptional 9.4% |
| Immigrants | Lithuania | 99.9 /100 | #13 | Exceptional 9.4% |
| Immigrants | North Macedonia | 99.8 /100 | #14 | Exceptional 9.4% |
| Bhutanese | 99.8 /100 | #15 | Exceptional 9.5% |
| Luxembourgers | 99.8 /100 | #16 | Exceptional 9.5% |
| Norwegians | 99.8 /100 | #17 | Exceptional 9.5% |
| Lithuanians | 99.8 /100 | #18 | Exceptional 9.5% |
| Immigrants | Hong Kong | 99.7 /100 | #19 | Exceptional 9.6% |
| Latvians | 99.7 /100 | #20 | Exceptional 9.6% |