Cuban vs Immigrants from Lithuania Male Poverty
COMPARE
Cuban
Immigrants from Lithuania
Male Poverty
Male Poverty Comparison
Cubans
Immigrants from Lithuania
12.4%
MALE POVERTY
1.3/ 100
METRIC RATING
229th/ 347
METRIC RANK
9.4%
MALE POVERTY
99.9/ 100
METRIC RATING
13th/ 347
METRIC RANK
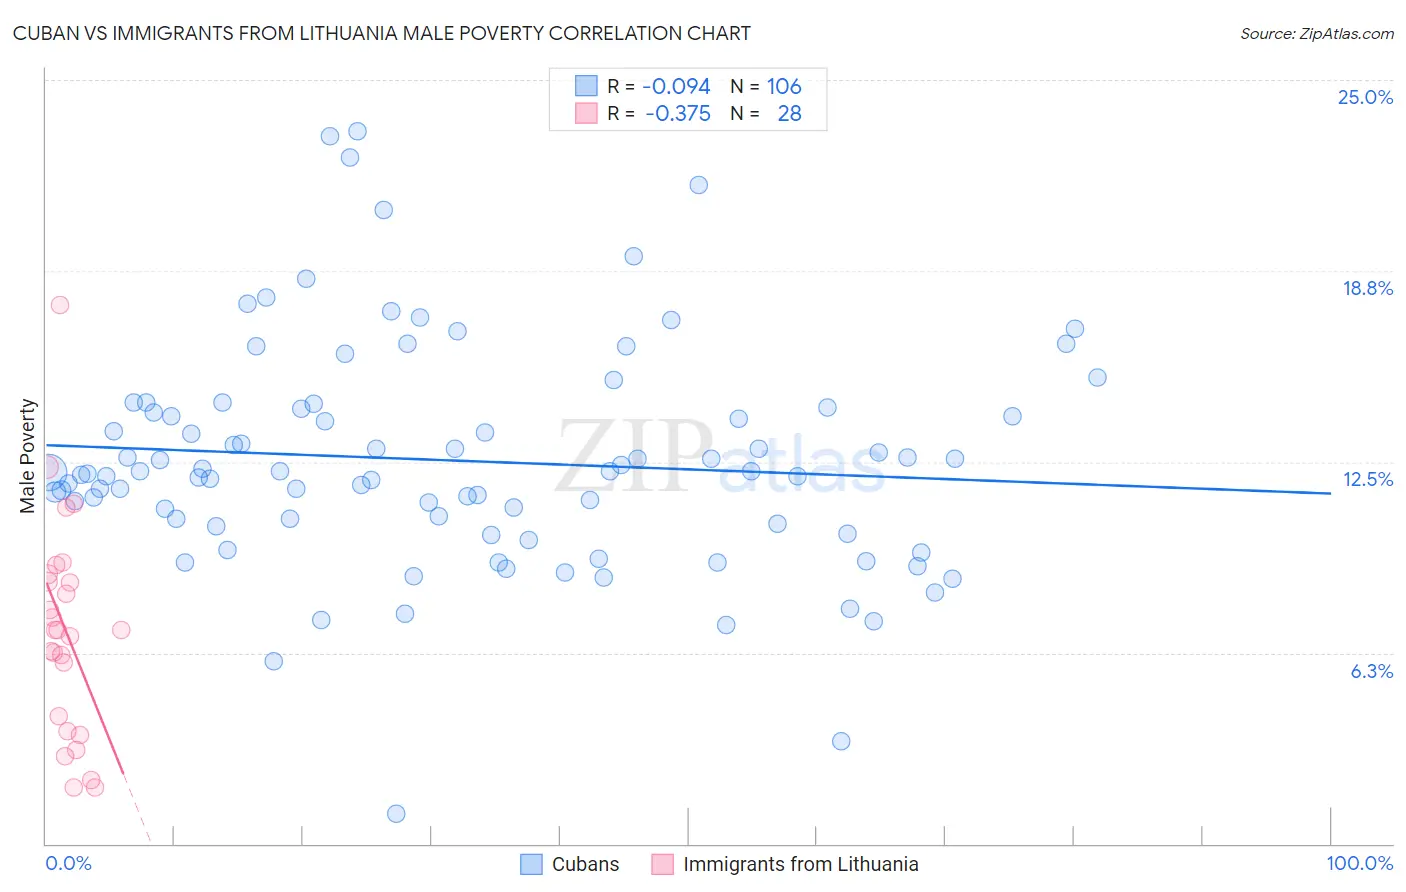
Cuban vs Immigrants from Lithuania Male Poverty Correlation Chart
The statistical analysis conducted on geographies consisting of 448,765,698 people shows a slight negative correlation between the proportion of Cubans and poverty level among males in the United States with a correlation coefficient (R) of -0.094 and weighted average of 12.4%. Similarly, the statistical analysis conducted on geographies consisting of 117,705,146 people shows a mild negative correlation between the proportion of Immigrants from Lithuania and poverty level among males in the United States with a correlation coefficient (R) of -0.375 and weighted average of 9.4%, a difference of 31.6%.
Male Poverty Correlation Summary
| Measurement | Cuban | Immigrants from Lithuania |
| Minimum | 0.97% | 1.8% |
| Maximum | 23.3% | 17.6% |
| Range | 22.4% | 15.8% |
| Mean | 12.5% | 7.0% |
| Median | 12.2% | 7.0% |
| Interquartile 25% (IQ1) | 10.5% | 3.9% |
| Interquartile 75% (IQ3) | 14.2% | 8.7% |
| Interquartile Range (IQR) | 3.8% | 4.8% |
| Standard Deviation (Sample) | 3.7% | 3.5% |
| Standard Deviation (Population) | 3.7% | 3.5% |
Similar Demographics by Male Poverty
Demographics Similar to Cubans by Male Poverty
In terms of male poverty, the demographic groups most similar to Cubans are Alsatian (12.4%, a difference of 0.090%), Alaska Native (12.4%, a difference of 0.13%), Nigerian (12.3%, a difference of 0.23%), Osage (12.3%, a difference of 0.39%), and Immigrants from Nigeria (12.3%, a difference of 0.45%).
| Demographics | Rating | Rank | Male Poverty |
| Immigrants | Africa | 2.1 /100 | #222 | Tragic 12.2% |
| Immigrants | Micronesia | 2.1 /100 | #223 | Tragic 12.2% |
| Immigrants | Nigeria | 1.6 /100 | #224 | Tragic 12.3% |
| Osage | 1.5 /100 | #225 | Tragic 12.3% |
| Nigerians | 1.4 /100 | #226 | Tragic 12.3% |
| Alaska Natives | 1.4 /100 | #227 | Tragic 12.4% |
| Alsatians | 1.3 /100 | #228 | Tragic 12.4% |
| Cubans | 1.3 /100 | #229 | Tragic 12.4% |
| Marshallese | 0.8 /100 | #230 | Tragic 12.5% |
| Salvadorans | 0.6 /100 | #231 | Tragic 12.6% |
| Nicaraguans | 0.6 /100 | #232 | Tragic 12.6% |
| Fijians | 0.6 /100 | #233 | Tragic 12.6% |
| Immigrants | Armenia | 0.6 /100 | #234 | Tragic 12.6% |
| Immigrants | Laos | 0.5 /100 | #235 | Tragic 12.6% |
| Immigrants | Saudi Arabia | 0.4 /100 | #236 | Tragic 12.7% |
Demographics Similar to Immigrants from Lithuania by Male Poverty
In terms of male poverty, the demographic groups most similar to Immigrants from Lithuania are Immigrants from Bolivia (9.4%, a difference of 0.12%), Bolivian (9.4%, a difference of 0.17%), Immigrants from North Macedonia (9.4%, a difference of 0.38%), Bhutanese (9.5%, a difference of 0.67%), and Bulgarian (9.3%, a difference of 0.82%).
| Demographics | Rating | Rank | Male Poverty |
| Assyrians/Chaldeans/Syriacs | 99.9 /100 | #6 | Exceptional 9.1% |
| Immigrants | Ireland | 99.9 /100 | #7 | Exceptional 9.1% |
| Filipinos | 99.9 /100 | #8 | Exceptional 9.2% |
| Immigrants | South Central Asia | 99.9 /100 | #9 | Exceptional 9.3% |
| Bulgarians | 99.9 /100 | #10 | Exceptional 9.3% |
| Bolivians | 99.9 /100 | #11 | Exceptional 9.4% |
| Immigrants | Bolivia | 99.9 /100 | #12 | Exceptional 9.4% |
| Immigrants | Lithuania | 99.9 /100 | #13 | Exceptional 9.4% |
| Immigrants | North Macedonia | 99.8 /100 | #14 | Exceptional 9.4% |
| Bhutanese | 99.8 /100 | #15 | Exceptional 9.5% |
| Luxembourgers | 99.8 /100 | #16 | Exceptional 9.5% |
| Norwegians | 99.8 /100 | #17 | Exceptional 9.5% |
| Lithuanians | 99.8 /100 | #18 | Exceptional 9.5% |
| Immigrants | Hong Kong | 99.7 /100 | #19 | Exceptional 9.6% |
| Latvians | 99.7 /100 | #20 | Exceptional 9.6% |