Irish vs Immigrants from Lithuania Male Poverty
COMPARE
Irish
Immigrants from Lithuania
Male Poverty
Male Poverty Comparison
Irish
Immigrants from Lithuania
10.3%
MALE POVERTY
96.8/ 100
METRIC RATING
78th/ 347
METRIC RANK
9.4%
MALE POVERTY
99.9/ 100
METRIC RATING
13th/ 347
METRIC RANK
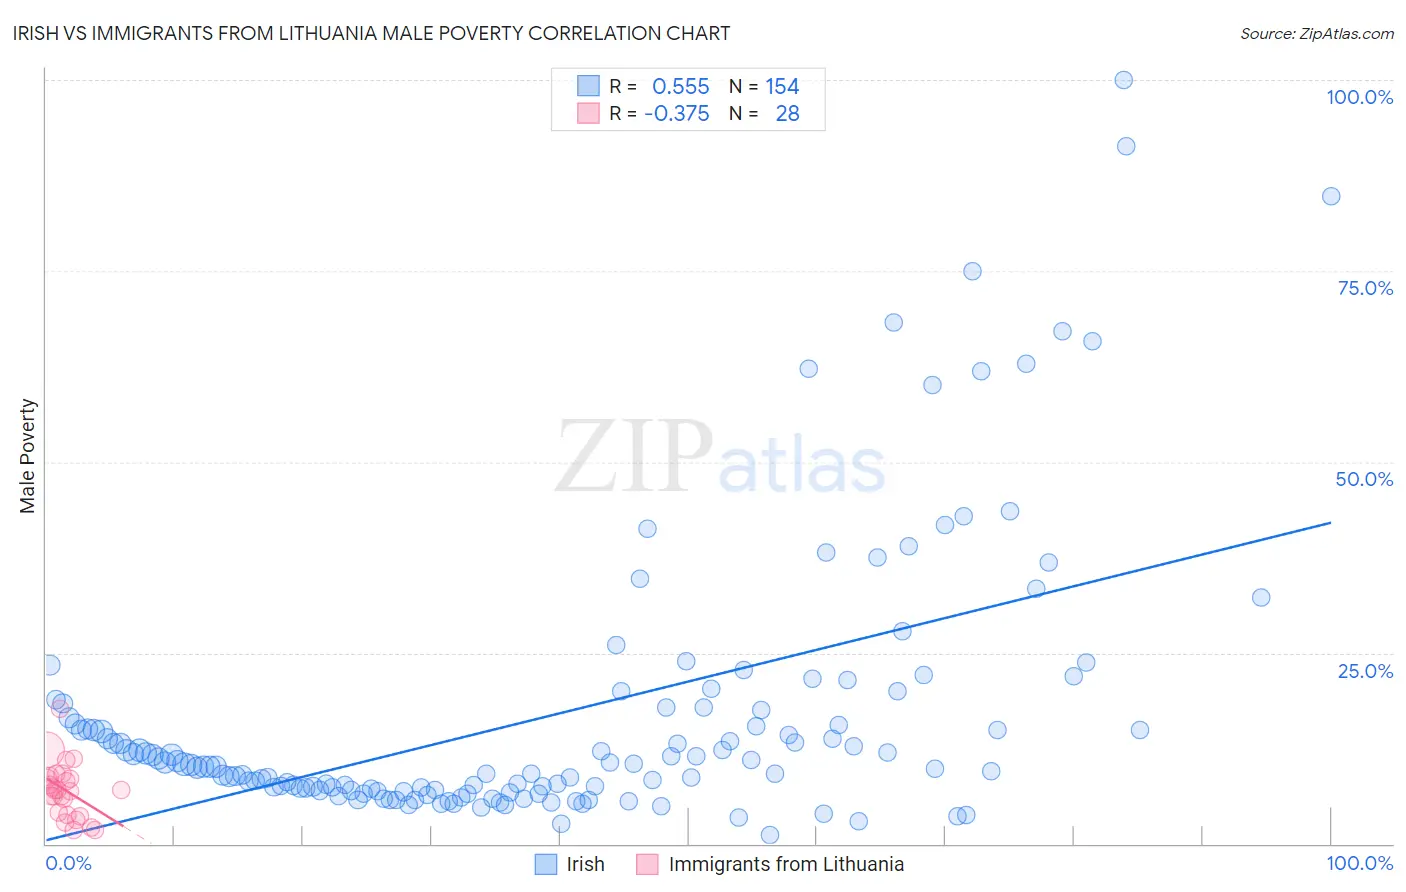
Irish vs Immigrants from Lithuania Male Poverty Correlation Chart
The statistical analysis conducted on geographies consisting of 578,330,947 people shows a substantial positive correlation between the proportion of Irish and poverty level among males in the United States with a correlation coefficient (R) of 0.555 and weighted average of 10.3%. Similarly, the statistical analysis conducted on geographies consisting of 117,705,146 people shows a mild negative correlation between the proportion of Immigrants from Lithuania and poverty level among males in the United States with a correlation coefficient (R) of -0.375 and weighted average of 9.4%, a difference of 9.0%.
Male Poverty Correlation Summary
| Measurement | Irish | Immigrants from Lithuania |
| Minimum | 1.2% | 1.8% |
| Maximum | 100.0% | 17.6% |
| Range | 98.8% | 15.8% |
| Mean | 17.0% | 7.0% |
| Median | 10.4% | 7.0% |
| Interquartile 25% (IQ1) | 7.0% | 3.9% |
| Interquartile 75% (IQ3) | 17.8% | 8.7% |
| Interquartile Range (IQR) | 10.8% | 4.8% |
| Standard Deviation (Sample) | 18.1% | 3.5% |
| Standard Deviation (Population) | 18.1% | 3.5% |
Similar Demographics by Male Poverty
Demographics Similar to Irish by Male Poverty
In terms of male poverty, the demographic groups most similar to Irish are Immigrants from Belgium (10.3%, a difference of 0.020%), Dutch (10.2%, a difference of 0.050%), Carpatho Rusyn (10.2%, a difference of 0.060%), Immigrants from Eastern Europe (10.2%, a difference of 0.070%), and Immigrants from Asia (10.2%, a difference of 0.14%).
| Demographics | Rating | Rank | Male Poverty |
| Europeans | 97.1 /100 | #71 | Exceptional 10.2% |
| Immigrants | Canada | 97.1 /100 | #72 | Exceptional 10.2% |
| Immigrants | Asia | 97.0 /100 | #73 | Exceptional 10.2% |
| Immigrants | Eastern Europe | 96.9 /100 | #74 | Exceptional 10.2% |
| Carpatho Rusyns | 96.9 /100 | #75 | Exceptional 10.2% |
| Dutch | 96.9 /100 | #76 | Exceptional 10.2% |
| Immigrants | Belgium | 96.8 /100 | #77 | Exceptional 10.3% |
| Irish | 96.8 /100 | #78 | Exceptional 10.3% |
| Immigrants | North America | 96.5 /100 | #79 | Exceptional 10.3% |
| English | 96.4 /100 | #80 | Exceptional 10.3% |
| Belgians | 95.9 /100 | #81 | Exceptional 10.3% |
| Egyptians | 95.9 /100 | #82 | Exceptional 10.3% |
| Immigrants | Sweden | 95.7 /100 | #83 | Exceptional 10.3% |
| Czechoslovakians | 95.6 /100 | #84 | Exceptional 10.3% |
| Immigrants | England | 95.5 /100 | #85 | Exceptional 10.4% |
Demographics Similar to Immigrants from Lithuania by Male Poverty
In terms of male poverty, the demographic groups most similar to Immigrants from Lithuania are Immigrants from Bolivia (9.4%, a difference of 0.12%), Bolivian (9.4%, a difference of 0.17%), Immigrants from North Macedonia (9.4%, a difference of 0.38%), Bhutanese (9.5%, a difference of 0.67%), and Bulgarian (9.3%, a difference of 0.82%).
| Demographics | Rating | Rank | Male Poverty |
| Assyrians/Chaldeans/Syriacs | 99.9 /100 | #6 | Exceptional 9.1% |
| Immigrants | Ireland | 99.9 /100 | #7 | Exceptional 9.1% |
| Filipinos | 99.9 /100 | #8 | Exceptional 9.2% |
| Immigrants | South Central Asia | 99.9 /100 | #9 | Exceptional 9.3% |
| Bulgarians | 99.9 /100 | #10 | Exceptional 9.3% |
| Bolivians | 99.9 /100 | #11 | Exceptional 9.4% |
| Immigrants | Bolivia | 99.9 /100 | #12 | Exceptional 9.4% |
| Immigrants | Lithuania | 99.9 /100 | #13 | Exceptional 9.4% |
| Immigrants | North Macedonia | 99.8 /100 | #14 | Exceptional 9.4% |
| Bhutanese | 99.8 /100 | #15 | Exceptional 9.5% |
| Luxembourgers | 99.8 /100 | #16 | Exceptional 9.5% |
| Norwegians | 99.8 /100 | #17 | Exceptional 9.5% |
| Lithuanians | 99.8 /100 | #18 | Exceptional 9.5% |
| Immigrants | Hong Kong | 99.7 /100 | #19 | Exceptional 9.6% |
| Latvians | 99.7 /100 | #20 | Exceptional 9.6% |