Tsimshian vs Immigrants from Korea Single Mother Poverty
COMPARE
Tsimshian
Immigrants from Korea
Single Mother Poverty
Single Mother Poverty Comparison
Tsimshian
Immigrants from Korea
26.8%
SINGLE MOTHER POVERTY
99.9/ 100
METRIC RATING
43rd/ 347
METRIC RANK
26.2%
SINGLE MOTHER POVERTY
100.0/ 100
METRIC RATING
22nd/ 347
METRIC RANK
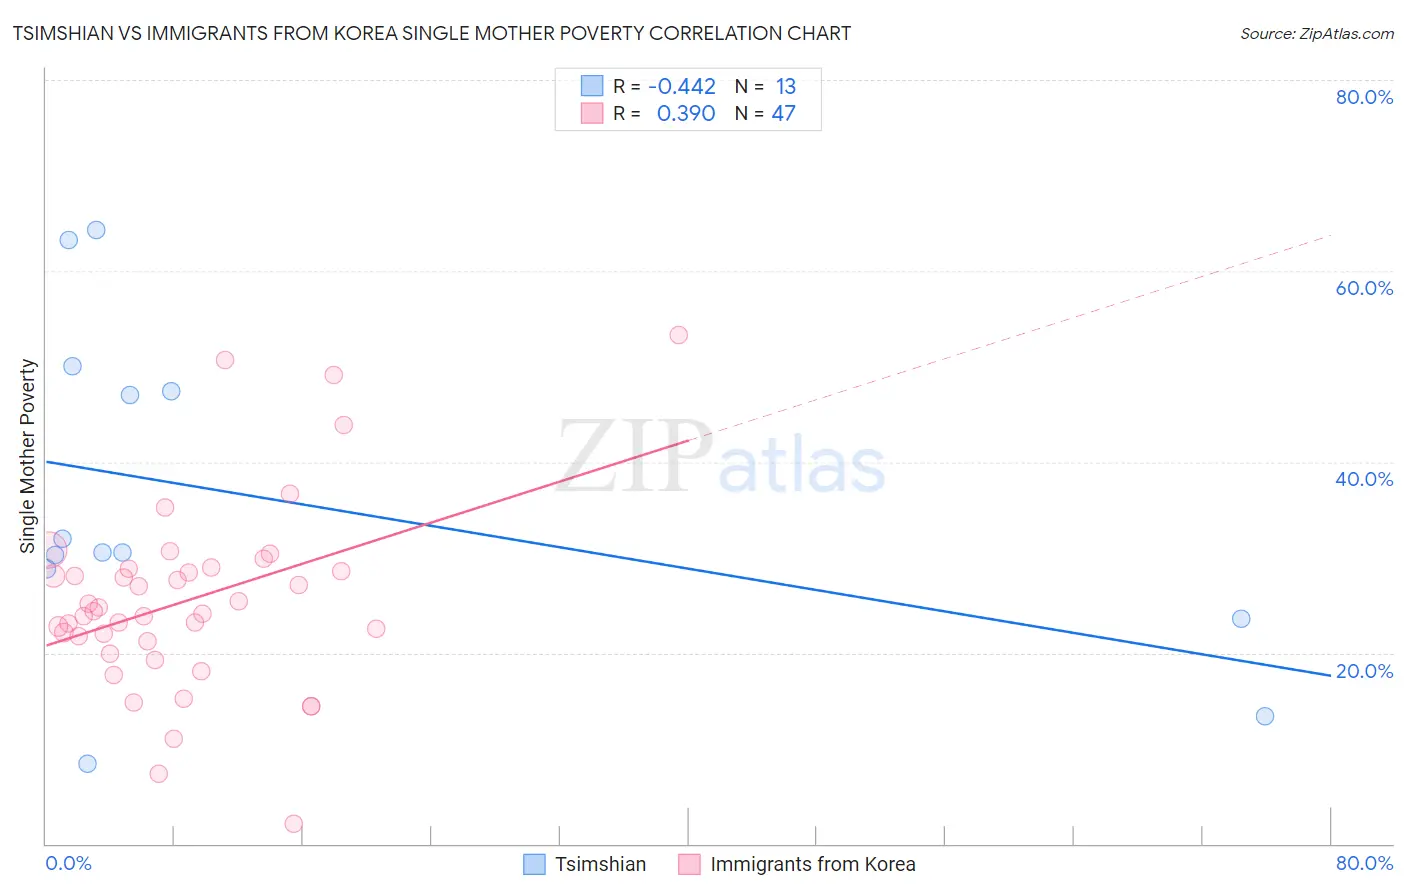
Tsimshian vs Immigrants from Korea Single Mother Poverty Correlation Chart
The statistical analysis conducted on geographies consisting of 15,606,004 people shows a moderate negative correlation between the proportion of Tsimshian and poverty level among single mothers in the United States with a correlation coefficient (R) of -0.442 and weighted average of 26.8%. Similarly, the statistical analysis conducted on geographies consisting of 404,112,179 people shows a mild positive correlation between the proportion of Immigrants from Korea and poverty level among single mothers in the United States with a correlation coefficient (R) of 0.390 and weighted average of 26.2%, a difference of 2.4%.
Single Mother Poverty Correlation Summary
| Measurement | Tsimshian | Immigrants from Korea |
| Minimum | 8.3% | 2.1% |
| Maximum | 64.3% | 53.3% |
| Range | 56.0% | 51.2% |
| Mean | 36.1% | 25.5% |
| Median | 30.6% | 24.4% |
| Interquartile 25% (IQ1) | 26.2% | 21.2% |
| Interquartile 75% (IQ3) | 48.7% | 28.8% |
| Interquartile Range (IQR) | 22.5% | 7.5% |
| Standard Deviation (Sample) | 17.3% | 9.9% |
| Standard Deviation (Population) | 16.6% | 9.8% |
Similar Demographics by Single Mother Poverty
Demographics Similar to Tsimshian by Single Mother Poverty
In terms of single mother poverty, the demographic groups most similar to Tsimshian are Armenian (26.8%, a difference of 0.080%), Immigrants from Sierra Leone (26.9%, a difference of 0.14%), Latvian (26.9%, a difference of 0.21%), Immigrants from Serbia (26.9%, a difference of 0.26%), and Immigrants from Greece (26.7%, a difference of 0.31%).
| Demographics | Rating | Rank | Single Mother Poverty |
| Okinawans | 99.9 /100 | #36 | Exceptional 26.6% |
| Immigrants | Israel | 99.9 /100 | #37 | Exceptional 26.6% |
| Immigrants | Fiji | 99.9 /100 | #38 | Exceptional 26.6% |
| Sri Lankans | 99.9 /100 | #39 | Exceptional 26.7% |
| Immigrants | Vietnam | 99.9 /100 | #40 | Exceptional 26.7% |
| Immigrants | Greece | 99.9 /100 | #41 | Exceptional 26.7% |
| Armenians | 99.9 /100 | #42 | Exceptional 26.8% |
| Tsimshian | 99.9 /100 | #43 | Exceptional 26.8% |
| Immigrants | Sierra Leone | 99.9 /100 | #44 | Exceptional 26.9% |
| Latvians | 99.9 /100 | #45 | Exceptional 26.9% |
| Immigrants | Serbia | 99.9 /100 | #46 | Exceptional 26.9% |
| Egyptians | 99.8 /100 | #47 | Exceptional 26.9% |
| Immigrants | Poland | 99.8 /100 | #48 | Exceptional 26.9% |
| Cambodians | 99.8 /100 | #49 | Exceptional 27.0% |
| Laotians | 99.8 /100 | #50 | Exceptional 27.0% |
Demographics Similar to Immigrants from Korea by Single Mother Poverty
In terms of single mother poverty, the demographic groups most similar to Immigrants from Korea are Immigrants from Bolivia (26.2%, a difference of 0.17%), Burmese (26.2%, a difference of 0.17%), Immigrants from Moldova (26.2%, a difference of 0.20%), Immigrants from China (26.1%, a difference of 0.36%), and Immigrants from Asia (26.3%, a difference of 0.39%).
| Demographics | Rating | Rank | Single Mother Poverty |
| Immigrants | Ireland | 100.0 /100 | #15 | Exceptional 25.8% |
| Bolivians | 100.0 /100 | #16 | Exceptional 25.9% |
| Asians | 100.0 /100 | #17 | Exceptional 26.0% |
| Immigrants | Pakistan | 100.0 /100 | #18 | Exceptional 26.0% |
| Immigrants | Eastern Asia | 100.0 /100 | #19 | Exceptional 26.1% |
| Immigrants | China | 100.0 /100 | #20 | Exceptional 26.1% |
| Immigrants | Bolivia | 100.0 /100 | #21 | Exceptional 26.2% |
| Immigrants | Korea | 100.0 /100 | #22 | Exceptional 26.2% |
| Burmese | 100.0 /100 | #23 | Exceptional 26.2% |
| Immigrants | Moldova | 100.0 /100 | #24 | Exceptional 26.2% |
| Immigrants | Asia | 100.0 /100 | #25 | Exceptional 26.3% |
| Immigrants | Sri Lanka | 100.0 /100 | #26 | Exceptional 26.3% |
| Immigrants | Japan | 100.0 /100 | #27 | Exceptional 26.4% |
| Koreans | 100.0 /100 | #28 | Exceptional 26.4% |
| Jordanians | 100.0 /100 | #29 | Exceptional 26.4% |