Tsimshian vs Immigrants from Korea Family Poverty
COMPARE
Tsimshian
Immigrants from Korea
Family Poverty
Family Poverty Comparison
Tsimshian
Immigrants from Korea
8.8%
FAMILY POVERTY
69.3/ 100
METRIC RATING
157th/ 347
METRIC RANK
7.4%
FAMILY POVERTY
99.6/ 100
METRIC RATING
28th/ 347
METRIC RANK
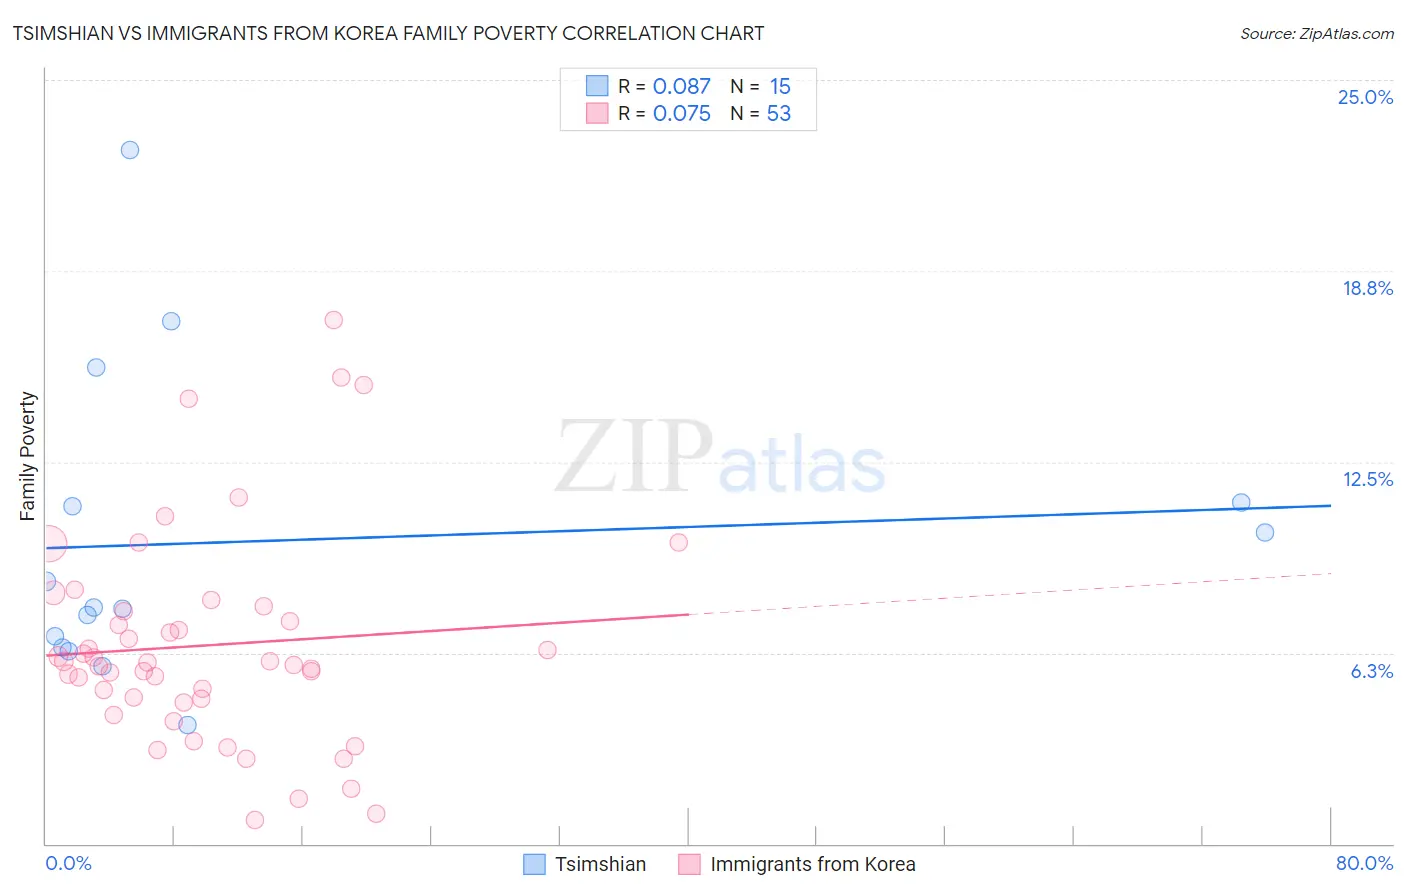
Tsimshian vs Immigrants from Korea Family Poverty Correlation Chart
The statistical analysis conducted on geographies consisting of 15,624,889 people shows a slight positive correlation between the proportion of Tsimshian and poverty level among families in the United States with a correlation coefficient (R) of 0.087 and weighted average of 8.8%. Similarly, the statistical analysis conducted on geographies consisting of 414,824,351 people shows a slight positive correlation between the proportion of Immigrants from Korea and poverty level among families in the United States with a correlation coefficient (R) of 0.075 and weighted average of 7.4%, a difference of 18.9%.
Family Poverty Correlation Summary
| Measurement | Tsimshian | Immigrants from Korea |
| Minimum | 3.9% | 0.76% |
| Maximum | 22.7% | 17.2% |
| Range | 18.9% | 16.4% |
| Mean | 9.9% | 6.5% |
| Median | 7.7% | 5.9% |
| Interquartile 25% (IQ1) | 6.4% | 4.7% |
| Interquartile 75% (IQ3) | 11.2% | 7.7% |
| Interquartile Range (IQR) | 4.7% | 3.0% |
| Standard Deviation (Sample) | 5.0% | 3.5% |
| Standard Deviation (Population) | 4.9% | 3.5% |
Similar Demographics by Family Poverty
Demographics Similar to Tsimshian by Family Poverty
In terms of family poverty, the demographic groups most similar to Tsimshian are White/Caucasian (8.8%, a difference of 0.040%), Peruvian (8.8%, a difference of 0.20%), Immigrants from Oceania (8.7%, a difference of 0.30%), Hungarian (8.8%, a difference of 0.34%), and Immigrants from Northern Africa (8.8%, a difference of 0.38%).
| Demographics | Rating | Rank | Family Poverty |
| Syrians | 80.3 /100 | #150 | Excellent 8.6% |
| Brazilians | 80.1 /100 | #151 | Excellent 8.6% |
| Samoans | 79.8 /100 | #152 | Good 8.6% |
| Immigrants | Spain | 79.1 /100 | #153 | Good 8.6% |
| Immigrants | Vietnam | 75.4 /100 | #154 | Good 8.7% |
| Immigrants | Kuwait | 73.6 /100 | #155 | Good 8.7% |
| Immigrants | Oceania | 71.2 /100 | #156 | Good 8.7% |
| Tsimshian | 69.3 /100 | #157 | Good 8.8% |
| Whites/Caucasians | 69.1 /100 | #158 | Good 8.8% |
| Peruvians | 68.0 /100 | #159 | Good 8.8% |
| Hungarians | 67.2 /100 | #160 | Good 8.8% |
| Immigrants | Northern Africa | 66.9 /100 | #161 | Good 8.8% |
| Ethiopians | 66.3 /100 | #162 | Good 8.8% |
| Pennsylvania Germans | 66.0 /100 | #163 | Good 8.8% |
| Celtics | 64.9 /100 | #164 | Good 8.8% |
Demographics Similar to Immigrants from Korea by Family Poverty
In terms of family poverty, the demographic groups most similar to Immigrants from Korea are Immigrants from Northern Europe (7.4%, a difference of 0.17%), Immigrants from Scotland (7.3%, a difference of 0.39%), Cypriot (7.3%, a difference of 0.40%), Italian (7.4%, a difference of 0.46%), and Czech (7.4%, a difference of 0.58%).
| Demographics | Rating | Rank | Family Poverty |
| Immigrants | Iran | 99.7 /100 | #21 | Exceptional 7.3% |
| Danes | 99.7 /100 | #22 | Exceptional 7.3% |
| Assyrians/Chaldeans/Syriacs | 99.7 /100 | #23 | Exceptional 7.3% |
| Croatians | 99.7 /100 | #24 | Exceptional 7.3% |
| Burmese | 99.7 /100 | #25 | Exceptional 7.3% |
| Cypriots | 99.6 /100 | #26 | Exceptional 7.3% |
| Immigrants | Scotland | 99.6 /100 | #27 | Exceptional 7.3% |
| Immigrants | Korea | 99.6 /100 | #28 | Exceptional 7.4% |
| Immigrants | Northern Europe | 99.6 /100 | #29 | Exceptional 7.4% |
| Italians | 99.6 /100 | #30 | Exceptional 7.4% |
| Czechs | 99.6 /100 | #31 | Exceptional 7.4% |
| Poles | 99.5 /100 | #32 | Exceptional 7.4% |
| Immigrants | Japan | 99.5 /100 | #33 | Exceptional 7.4% |
| Russians | 99.5 /100 | #34 | Exceptional 7.5% |
| Greeks | 99.4 /100 | #35 | Exceptional 7.5% |