Ukrainian vs Immigrants from Korea Single Mother Poverty
COMPARE
Ukrainian
Immigrants from Korea
Single Mother Poverty
Single Mother Poverty Comparison
Ukrainians
Immigrants from Korea
28.0%
SINGLE MOTHER POVERTY
96.4/ 100
METRIC RATING
106th/ 347
METRIC RANK
26.2%
SINGLE MOTHER POVERTY
100.0/ 100
METRIC RATING
22nd/ 347
METRIC RANK
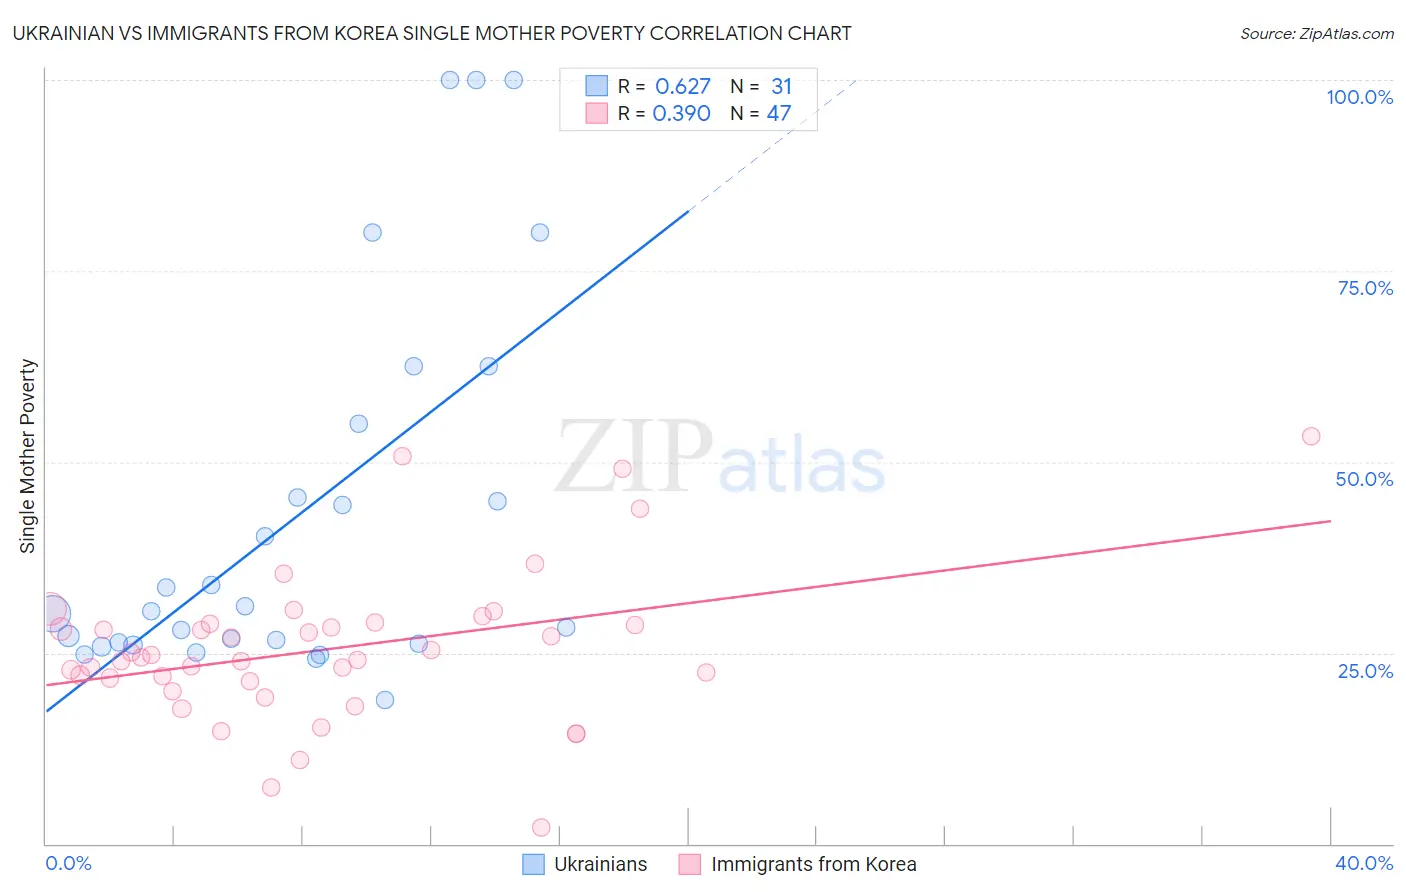
Ukrainian vs Immigrants from Korea Single Mother Poverty Correlation Chart
The statistical analysis conducted on geographies consisting of 432,495,804 people shows a significant positive correlation between the proportion of Ukrainians and poverty level among single mothers in the United States with a correlation coefficient (R) of 0.627 and weighted average of 28.0%. Similarly, the statistical analysis conducted on geographies consisting of 404,112,179 people shows a mild positive correlation between the proportion of Immigrants from Korea and poverty level among single mothers in the United States with a correlation coefficient (R) of 0.390 and weighted average of 26.2%, a difference of 7.0%.
Single Mother Poverty Correlation Summary
| Measurement | Ukrainian | Immigrants from Korea |
| Minimum | 18.8% | 2.1% |
| Maximum | 100.0% | 53.3% |
| Range | 81.2% | 51.2% |
| Mean | 43.0% | 25.5% |
| Median | 30.4% | 24.4% |
| Interquartile 25% (IQ1) | 26.3% | 21.2% |
| Interquartile 75% (IQ3) | 55.0% | 28.8% |
| Interquartile Range (IQR) | 28.7% | 7.5% |
| Standard Deviation (Sample) | 24.7% | 9.9% |
| Standard Deviation (Population) | 24.3% | 9.8% |
Similar Demographics by Single Mother Poverty
Demographics Similar to Ukrainians by Single Mother Poverty
In terms of single mother poverty, the demographic groups most similar to Ukrainians are Israeli (28.0%, a difference of 0.040%), Italian (28.0%, a difference of 0.070%), Immigrants from Northern Africa (28.0%, a difference of 0.090%), Immigrants from Croatia (28.0%, a difference of 0.10%), and Pakistani (28.0%, a difference of 0.20%).
| Demographics | Rating | Rank | Single Mother Poverty |
| Immigrants | Netherlands | 97.2 /100 | #99 | Exceptional 27.9% |
| Zimbabweans | 97.1 /100 | #100 | Exceptional 27.9% |
| Pakistanis | 96.9 /100 | #101 | Exceptional 28.0% |
| Immigrants | Croatia | 96.7 /100 | #102 | Exceptional 28.0% |
| Immigrants | Northern Africa | 96.6 /100 | #103 | Exceptional 28.0% |
| Italians | 96.6 /100 | #104 | Exceptional 28.0% |
| Israelis | 96.5 /100 | #105 | Exceptional 28.0% |
| Ukrainians | 96.4 /100 | #106 | Exceptional 28.0% |
| Immigrants | Venezuela | 95.8 /100 | #107 | Exceptional 28.1% |
| Immigrants | Zimbabwe | 95.5 /100 | #108 | Exceptional 28.1% |
| Immigrants | Armenia | 95.2 /100 | #109 | Exceptional 28.1% |
| Croatians | 94.8 /100 | #110 | Exceptional 28.2% |
| Venezuelans | 94.5 /100 | #111 | Exceptional 28.2% |
| Immigrants | Kazakhstan | 94.5 /100 | #112 | Exceptional 28.2% |
| Immigrants | South Africa | 93.2 /100 | #113 | Exceptional 28.3% |
Demographics Similar to Immigrants from Korea by Single Mother Poverty
In terms of single mother poverty, the demographic groups most similar to Immigrants from Korea are Immigrants from Bolivia (26.2%, a difference of 0.17%), Burmese (26.2%, a difference of 0.17%), Immigrants from Moldova (26.2%, a difference of 0.20%), Immigrants from China (26.1%, a difference of 0.36%), and Immigrants from Asia (26.3%, a difference of 0.39%).
| Demographics | Rating | Rank | Single Mother Poverty |
| Immigrants | Ireland | 100.0 /100 | #15 | Exceptional 25.8% |
| Bolivians | 100.0 /100 | #16 | Exceptional 25.9% |
| Asians | 100.0 /100 | #17 | Exceptional 26.0% |
| Immigrants | Pakistan | 100.0 /100 | #18 | Exceptional 26.0% |
| Immigrants | Eastern Asia | 100.0 /100 | #19 | Exceptional 26.1% |
| Immigrants | China | 100.0 /100 | #20 | Exceptional 26.1% |
| Immigrants | Bolivia | 100.0 /100 | #21 | Exceptional 26.2% |
| Immigrants | Korea | 100.0 /100 | #22 | Exceptional 26.2% |
| Burmese | 100.0 /100 | #23 | Exceptional 26.2% |
| Immigrants | Moldova | 100.0 /100 | #24 | Exceptional 26.2% |
| Immigrants | Asia | 100.0 /100 | #25 | Exceptional 26.3% |
| Immigrants | Sri Lanka | 100.0 /100 | #26 | Exceptional 26.3% |
| Immigrants | Japan | 100.0 /100 | #27 | Exceptional 26.4% |
| Koreans | 100.0 /100 | #28 | Exceptional 26.4% |
| Jordanians | 100.0 /100 | #29 | Exceptional 26.4% |