Tsimshian vs Romanian Single Mother Poverty
COMPARE
Tsimshian
Romanian
Single Mother Poverty
Single Mother Poverty Comparison
Tsimshian
Romanians
26.8%
SINGLE MOTHER POVERTY
99.9/ 100
METRIC RATING
43rd/ 347
METRIC RANK
27.8%
SINGLE MOTHER POVERTY
97.8/ 100
METRIC RATING
93rd/ 347
METRIC RANK
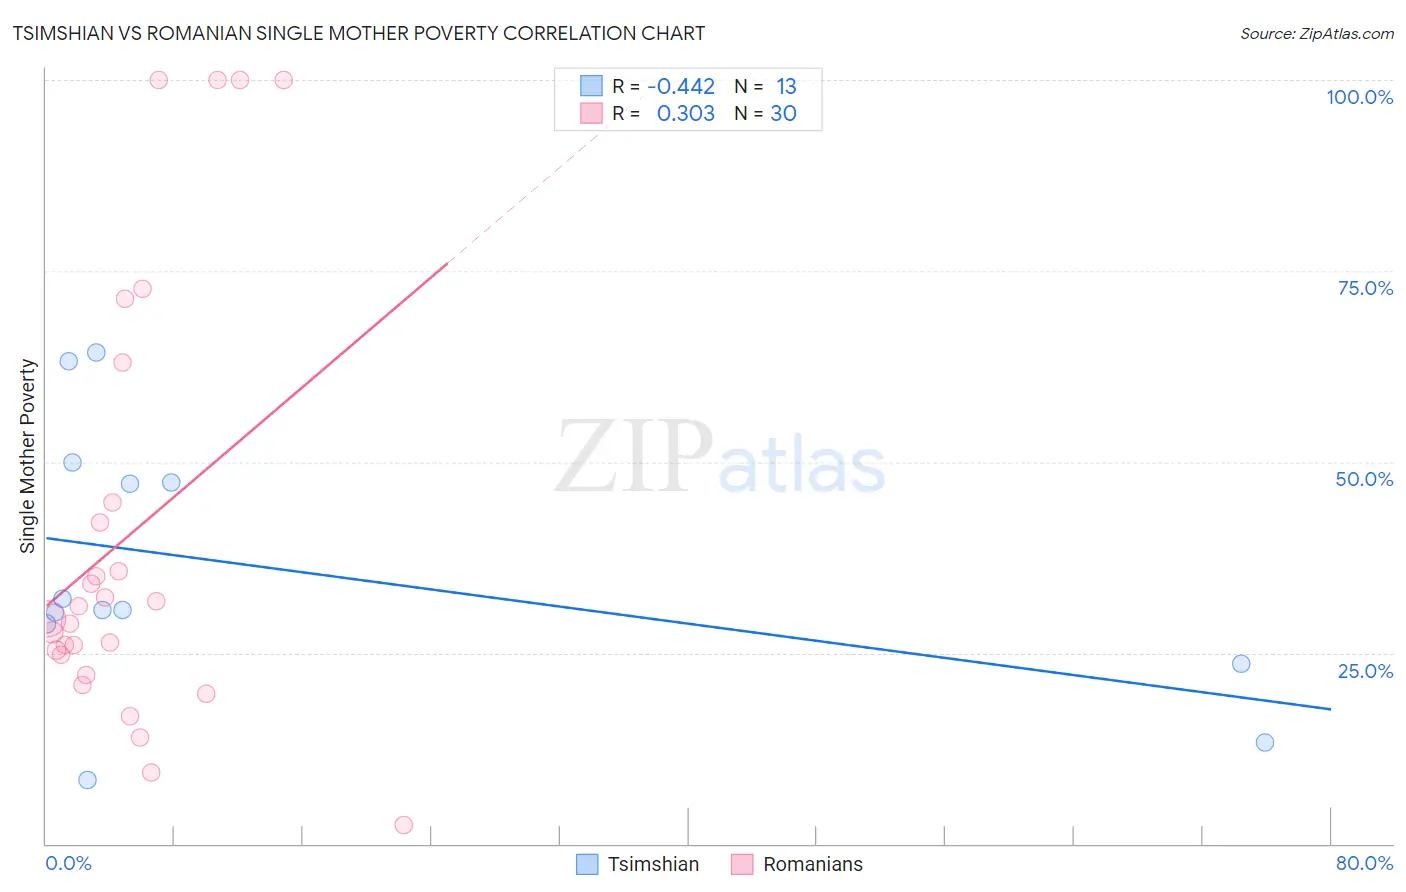
Tsimshian vs Romanian Single Mother Poverty Correlation Chart
The statistical analysis conducted on geographies consisting of 15,606,004 people shows a moderate negative correlation between the proportion of Tsimshian and poverty level among single mothers in the United States with a correlation coefficient (R) of -0.442 and weighted average of 26.8%. Similarly, the statistical analysis conducted on geographies consisting of 367,510,657 people shows a mild positive correlation between the proportion of Romanians and poverty level among single mothers in the United States with a correlation coefficient (R) of 0.303 and weighted average of 27.8%, a difference of 3.8%.
Single Mother Poverty Correlation Summary
| Measurement | Tsimshian | Romanian |
| Minimum | 8.3% | 2.5% |
| Maximum | 64.3% | 100.0% |
| Range | 56.0% | 97.5% |
| Mean | 36.1% | 40.4% |
| Median | 30.6% | 30.2% |
| Interquartile 25% (IQ1) | 26.2% | 24.8% |
| Interquartile 75% (IQ3) | 48.7% | 44.7% |
| Interquartile Range (IQR) | 22.5% | 19.9% |
| Standard Deviation (Sample) | 17.3% | 28.4% |
| Standard Deviation (Population) | 16.6% | 27.9% |
Similar Demographics by Single Mother Poverty
Demographics Similar to Tsimshian by Single Mother Poverty
In terms of single mother poverty, the demographic groups most similar to Tsimshian are Armenian (26.8%, a difference of 0.080%), Immigrants from Sierra Leone (26.9%, a difference of 0.14%), Latvian (26.9%, a difference of 0.21%), Immigrants from Serbia (26.9%, a difference of 0.26%), and Immigrants from Greece (26.7%, a difference of 0.31%).
| Demographics | Rating | Rank | Single Mother Poverty |
| Okinawans | 99.9 /100 | #36 | Exceptional 26.6% |
| Immigrants | Israel | 99.9 /100 | #37 | Exceptional 26.6% |
| Immigrants | Fiji | 99.9 /100 | #38 | Exceptional 26.6% |
| Sri Lankans | 99.9 /100 | #39 | Exceptional 26.7% |
| Immigrants | Vietnam | 99.9 /100 | #40 | Exceptional 26.7% |
| Immigrants | Greece | 99.9 /100 | #41 | Exceptional 26.7% |
| Armenians | 99.9 /100 | #42 | Exceptional 26.8% |
| Tsimshian | 99.9 /100 | #43 | Exceptional 26.8% |
| Immigrants | Sierra Leone | 99.9 /100 | #44 | Exceptional 26.9% |
| Latvians | 99.9 /100 | #45 | Exceptional 26.9% |
| Immigrants | Serbia | 99.9 /100 | #46 | Exceptional 26.9% |
| Egyptians | 99.8 /100 | #47 | Exceptional 26.9% |
| Immigrants | Poland | 99.8 /100 | #48 | Exceptional 26.9% |
| Cambodians | 99.8 /100 | #49 | Exceptional 27.0% |
| Laotians | 99.8 /100 | #50 | Exceptional 27.0% |
Demographics Similar to Romanians by Single Mother Poverty
In terms of single mother poverty, the demographic groups most similar to Romanians are Estonian (27.8%, a difference of 0.10%), Albanian (27.9%, a difference of 0.10%), Immigrants from Albania (27.8%, a difference of 0.12%), Chilean (27.9%, a difference of 0.13%), and Immigrants from Iraq (27.9%, a difference of 0.23%).
| Demographics | Rating | Rank | Single Mother Poverty |
| Immigrants | Ukraine | 98.6 /100 | #86 | Exceptional 27.7% |
| Afghans | 98.5 /100 | #87 | Exceptional 27.7% |
| Ethiopians | 98.4 /100 | #88 | Exceptional 27.7% |
| Immigrants | Ethiopia | 98.4 /100 | #89 | Exceptional 27.7% |
| Immigrants | France | 98.2 /100 | #90 | Exceptional 27.8% |
| Immigrants | Albania | 98.0 /100 | #91 | Exceptional 27.8% |
| Estonians | 97.9 /100 | #92 | Exceptional 27.8% |
| Romanians | 97.8 /100 | #93 | Exceptional 27.8% |
| Albanians | 97.6 /100 | #94 | Exceptional 27.9% |
| Chileans | 97.5 /100 | #95 | Exceptional 27.9% |
| Immigrants | Iraq | 97.3 /100 | #96 | Exceptional 27.9% |
| Immigrants | Brazil | 97.2 /100 | #97 | Exceptional 27.9% |
| Immigrants | Nepal | 97.2 /100 | #98 | Exceptional 27.9% |
| Immigrants | Netherlands | 97.2 /100 | #99 | Exceptional 27.9% |
| Zimbabweans | 97.1 /100 | #100 | Exceptional 27.9% |