Tsimshian vs Delaware Single Mother Poverty
COMPARE
Tsimshian
Delaware
Single Mother Poverty
Single Mother Poverty Comparison
Tsimshian
Delaware
26.8%
SINGLE MOTHER POVERTY
99.9/ 100
METRIC RATING
43rd/ 347
METRIC RANK
31.8%
SINGLE MOTHER POVERTY
0.0/ 100
METRIC RATING
276th/ 347
METRIC RANK
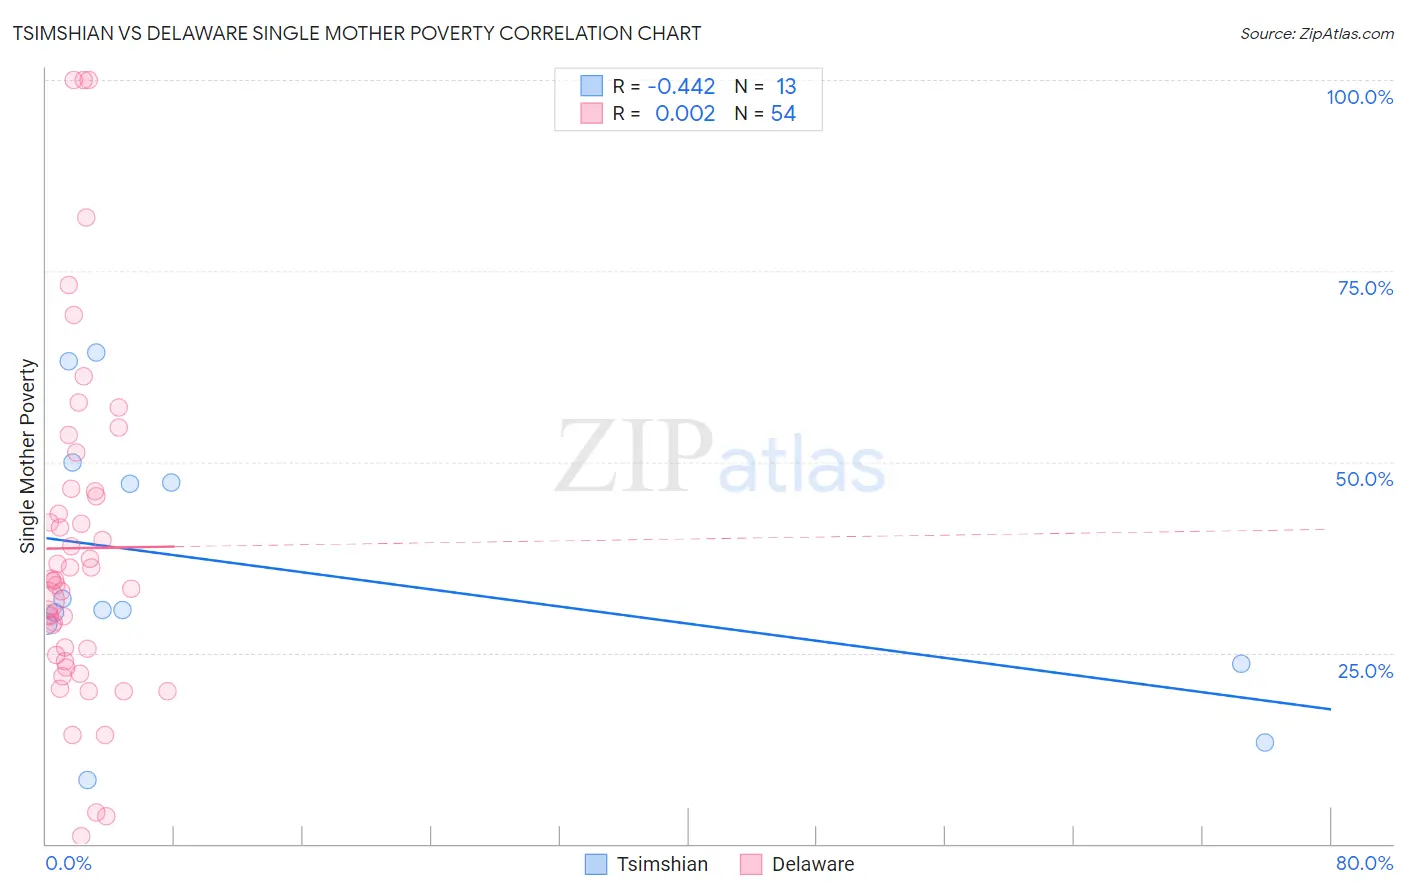
Tsimshian vs Delaware Single Mother Poverty Correlation Chart
The statistical analysis conducted on geographies consisting of 15,606,004 people shows a moderate negative correlation between the proportion of Tsimshian and poverty level among single mothers in the United States with a correlation coefficient (R) of -0.442 and weighted average of 26.8%. Similarly, the statistical analysis conducted on geographies consisting of 95,376,359 people shows no correlation between the proportion of Delaware and poverty level among single mothers in the United States with a correlation coefficient (R) of 0.002 and weighted average of 31.8%, a difference of 18.7%.
Single Mother Poverty Correlation Summary
| Measurement | Tsimshian | Delaware |
| Minimum | 8.3% | 1.1% |
| Maximum | 64.3% | 100.0% |
| Range | 56.0% | 98.9% |
| Mean | 36.1% | 38.7% |
| Median | 30.6% | 34.5% |
| Interquartile 25% (IQ1) | 26.2% | 24.8% |
| Interquartile 75% (IQ3) | 48.7% | 46.2% |
| Interquartile Range (IQR) | 22.5% | 21.4% |
| Standard Deviation (Sample) | 17.3% | 22.2% |
| Standard Deviation (Population) | 16.6% | 21.9% |
Similar Demographics by Single Mother Poverty
Demographics Similar to Tsimshian by Single Mother Poverty
In terms of single mother poverty, the demographic groups most similar to Tsimshian are Armenian (26.8%, a difference of 0.080%), Immigrants from Sierra Leone (26.9%, a difference of 0.14%), Latvian (26.9%, a difference of 0.21%), Immigrants from Serbia (26.9%, a difference of 0.26%), and Immigrants from Greece (26.7%, a difference of 0.31%).
| Demographics | Rating | Rank | Single Mother Poverty |
| Okinawans | 99.9 /100 | #36 | Exceptional 26.6% |
| Immigrants | Israel | 99.9 /100 | #37 | Exceptional 26.6% |
| Immigrants | Fiji | 99.9 /100 | #38 | Exceptional 26.6% |
| Sri Lankans | 99.9 /100 | #39 | Exceptional 26.7% |
| Immigrants | Vietnam | 99.9 /100 | #40 | Exceptional 26.7% |
| Immigrants | Greece | 99.9 /100 | #41 | Exceptional 26.7% |
| Armenians | 99.9 /100 | #42 | Exceptional 26.8% |
| Tsimshian | 99.9 /100 | #43 | Exceptional 26.8% |
| Immigrants | Sierra Leone | 99.9 /100 | #44 | Exceptional 26.9% |
| Latvians | 99.9 /100 | #45 | Exceptional 26.9% |
| Immigrants | Serbia | 99.9 /100 | #46 | Exceptional 26.9% |
| Egyptians | 99.8 /100 | #47 | Exceptional 26.9% |
| Immigrants | Poland | 99.8 /100 | #48 | Exceptional 26.9% |
| Cambodians | 99.8 /100 | #49 | Exceptional 27.0% |
| Laotians | 99.8 /100 | #50 | Exceptional 27.0% |
Demographics Similar to Delaware by Single Mother Poverty
In terms of single mother poverty, the demographic groups most similar to Delaware are Central American (31.8%, a difference of 0.16%), Mexican American Indian (31.9%, a difference of 0.21%), Bangladeshi (31.7%, a difference of 0.35%), Immigrants from Zaire (32.0%, a difference of 0.43%), and Fijian (31.6%, a difference of 0.58%).
| Demographics | Rating | Rank | Single Mother Poverty |
| Scotch-Irish | 0.1 /100 | #269 | Tragic 31.5% |
| British West Indians | 0.1 /100 | #270 | Tragic 31.5% |
| Immigrants | Cabo Verde | 0.1 /100 | #271 | Tragic 31.6% |
| Immigrants | Micronesia | 0.1 /100 | #272 | Tragic 31.6% |
| Fijians | 0.1 /100 | #273 | Tragic 31.6% |
| Bangladeshis | 0.1 /100 | #274 | Tragic 31.7% |
| Central Americans | 0.1 /100 | #275 | Tragic 31.8% |
| Delaware | 0.0 /100 | #276 | Tragic 31.8% |
| Mexican American Indians | 0.0 /100 | #277 | Tragic 31.9% |
| Immigrants | Zaire | 0.0 /100 | #278 | Tragic 32.0% |
| Marshallese | 0.0 /100 | #279 | Tragic 32.1% |
| Immigrants | Nonimmigrants | 0.0 /100 | #280 | Tragic 32.2% |
| Cree | 0.0 /100 | #281 | Tragic 32.2% |
| Immigrants | Azores | 0.0 /100 | #282 | Tragic 32.2% |
| Spanish Americans | 0.0 /100 | #283 | Tragic 32.3% |