Syrian vs Delaware Single Mother Poverty
COMPARE
Syrian
Delaware
Single Mother Poverty
Single Mother Poverty Comparison
Syrians
Delaware
28.6%
SINGLE MOTHER POVERTY
85.3/ 100
METRIC RATING
148th/ 347
METRIC RANK
31.8%
SINGLE MOTHER POVERTY
0.0/ 100
METRIC RATING
276th/ 347
METRIC RANK
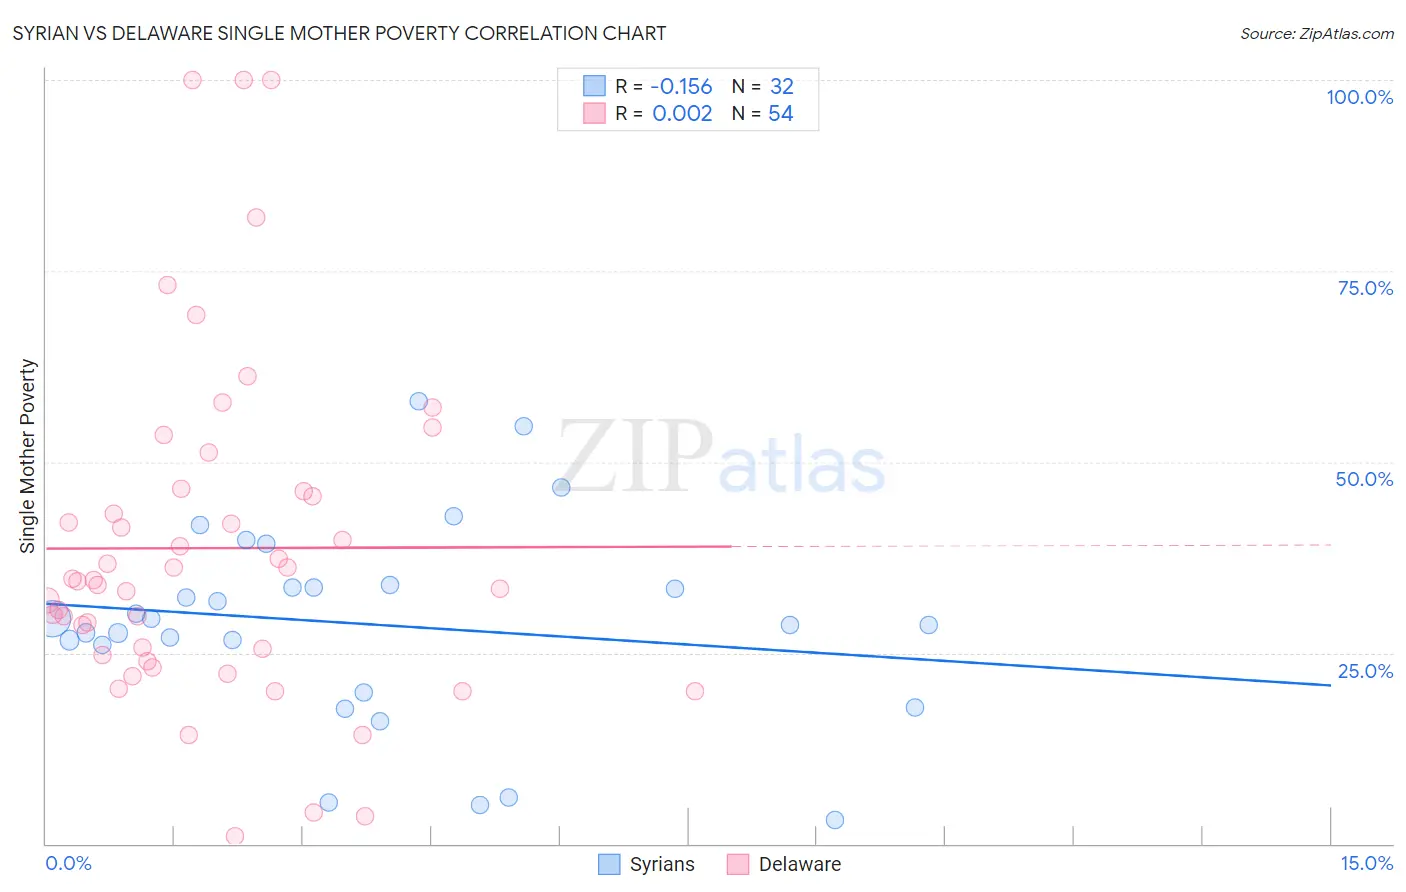
Syrian vs Delaware Single Mother Poverty Correlation Chart
The statistical analysis conducted on geographies consisting of 260,676,896 people shows a poor negative correlation between the proportion of Syrians and poverty level among single mothers in the United States with a correlation coefficient (R) of -0.156 and weighted average of 28.6%. Similarly, the statistical analysis conducted on geographies consisting of 95,376,359 people shows no correlation between the proportion of Delaware and poverty level among single mothers in the United States with a correlation coefficient (R) of 0.002 and weighted average of 31.8%, a difference of 11.5%.
Single Mother Poverty Correlation Summary
| Measurement | Syrian | Delaware |
| Minimum | 3.1% | 1.1% |
| Maximum | 58.0% | 100.0% |
| Range | 54.9% | 98.9% |
| Mean | 28.8% | 38.7% |
| Median | 29.0% | 34.5% |
| Interquartile 25% (IQ1) | 22.9% | 24.8% |
| Interquartile 75% (IQ3) | 33.7% | 46.2% |
| Interquartile Range (IQR) | 10.8% | 21.4% |
| Standard Deviation (Sample) | 13.2% | 22.2% |
| Standard Deviation (Population) | 12.9% | 21.9% |
Similar Demographics by Single Mother Poverty
Demographics Similar to Syrians by Single Mother Poverty
In terms of single mother poverty, the demographic groups most similar to Syrians are Immigrants from Lebanon (28.6%, a difference of 0.010%), Serbian (28.6%, a difference of 0.020%), Immigrants from South America (28.5%, a difference of 0.080%), Immigrants from Denmark (28.5%, a difference of 0.080%), and Luxembourger (28.5%, a difference of 0.12%).
| Demographics | Rating | Rank | Single Mother Poverty |
| Danes | 87.1 /100 | #141 | Excellent 28.5% |
| South Africans | 86.6 /100 | #142 | Excellent 28.5% |
| Immigrants | North America | 86.5 /100 | #143 | Excellent 28.5% |
| Luxembourgers | 86.4 /100 | #144 | Excellent 28.5% |
| Immigrants | South America | 86.1 /100 | #145 | Excellent 28.5% |
| Immigrants | Denmark | 86.1 /100 | #146 | Excellent 28.5% |
| Immigrants | Lebanon | 85.3 /100 | #147 | Excellent 28.6% |
| Syrians | 85.3 /100 | #148 | Excellent 28.6% |
| Serbians | 85.0 /100 | #149 | Excellent 28.6% |
| Northern Europeans | 81.7 /100 | #150 | Excellent 28.6% |
| Immigrants | Oceania | 79.9 /100 | #151 | Good 28.7% |
| Austrians | 79.0 /100 | #152 | Good 28.7% |
| Slovenes | 76.4 /100 | #153 | Good 28.8% |
| Portuguese | 73.2 /100 | #154 | Good 28.8% |
| Ugandans | 71.7 /100 | #155 | Good 28.8% |
Demographics Similar to Delaware by Single Mother Poverty
In terms of single mother poverty, the demographic groups most similar to Delaware are Central American (31.8%, a difference of 0.16%), Mexican American Indian (31.9%, a difference of 0.21%), Bangladeshi (31.7%, a difference of 0.35%), Immigrants from Zaire (32.0%, a difference of 0.43%), and Fijian (31.6%, a difference of 0.58%).
| Demographics | Rating | Rank | Single Mother Poverty |
| Scotch-Irish | 0.1 /100 | #269 | Tragic 31.5% |
| British West Indians | 0.1 /100 | #270 | Tragic 31.5% |
| Immigrants | Cabo Verde | 0.1 /100 | #271 | Tragic 31.6% |
| Immigrants | Micronesia | 0.1 /100 | #272 | Tragic 31.6% |
| Fijians | 0.1 /100 | #273 | Tragic 31.6% |
| Bangladeshis | 0.1 /100 | #274 | Tragic 31.7% |
| Central Americans | 0.1 /100 | #275 | Tragic 31.8% |
| Delaware | 0.0 /100 | #276 | Tragic 31.8% |
| Mexican American Indians | 0.0 /100 | #277 | Tragic 31.9% |
| Immigrants | Zaire | 0.0 /100 | #278 | Tragic 32.0% |
| Marshallese | 0.0 /100 | #279 | Tragic 32.1% |
| Immigrants | Nonimmigrants | 0.0 /100 | #280 | Tragic 32.2% |
| Cree | 0.0 /100 | #281 | Tragic 32.2% |
| Immigrants | Azores | 0.0 /100 | #282 | Tragic 32.2% |
| Spanish Americans | 0.0 /100 | #283 | Tragic 32.3% |