Tsimshian vs Delaware In Labor Force | Age 35-44
COMPARE
Tsimshian
Delaware
In Labor Force | Age 35-44
In Labor Force | Age 35-44 Comparison
Tsimshian
Delaware
83.5%
IN LABOR FORCE | AGE 35-44
0.2/ 100
METRIC RATING
258th/ 347
METRIC RANK
83.2%
IN LABOR FORCE | AGE 35-44
0.0/ 100
METRIC RATING
276th/ 347
METRIC RANK
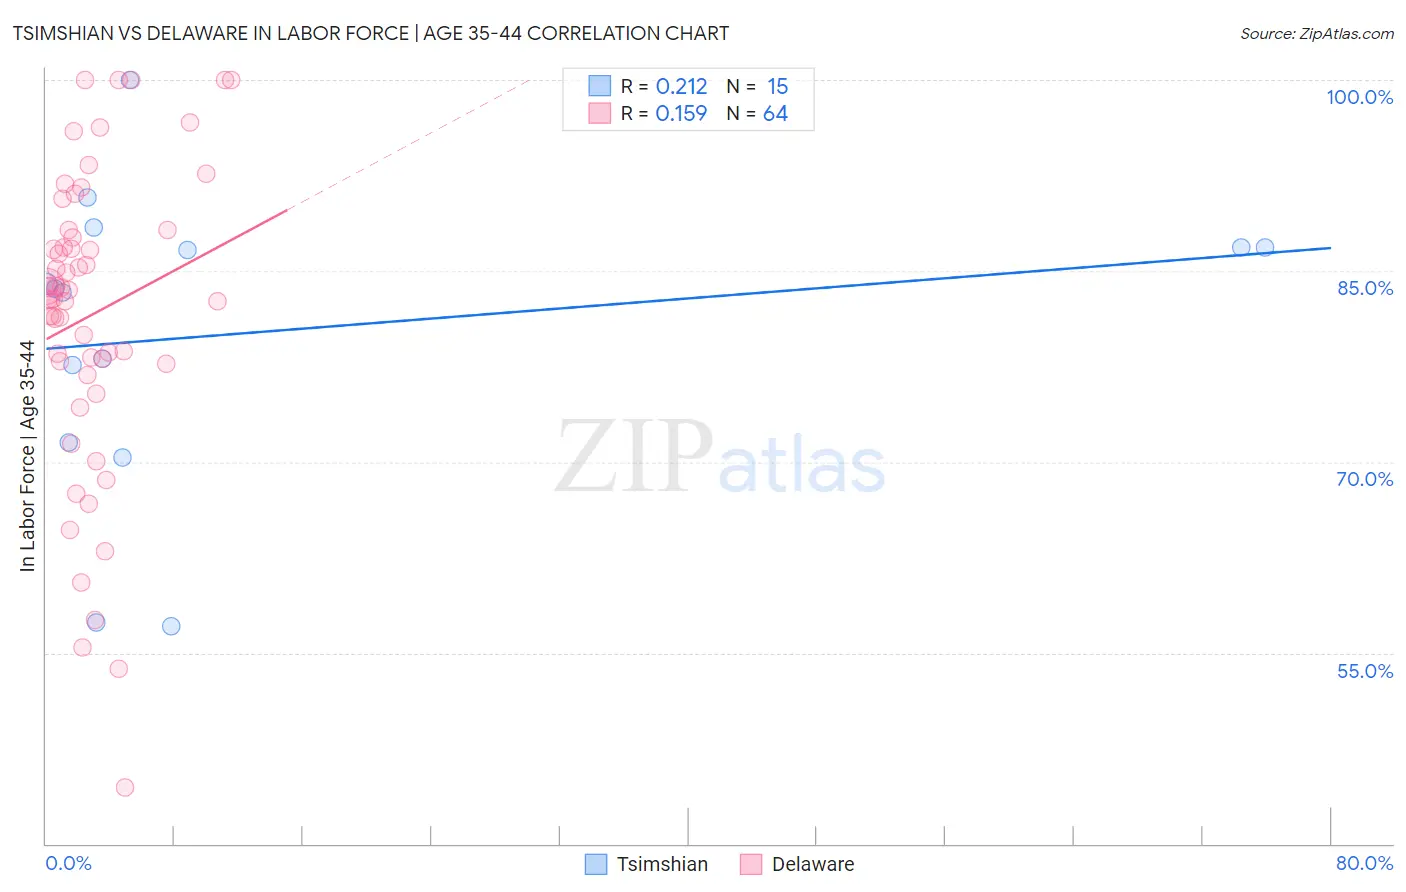
Tsimshian vs Delaware In Labor Force | Age 35-44 Correlation Chart
The statistical analysis conducted on geographies consisting of 15,626,462 people shows a weak positive correlation between the proportion of Tsimshian and labor force participation rate among population between the ages 35 and 44 in the United States with a correlation coefficient (R) of 0.212 and weighted average of 83.5%. Similarly, the statistical analysis conducted on geographies consisting of 96,216,045 people shows a poor positive correlation between the proportion of Delaware and labor force participation rate among population between the ages 35 and 44 in the United States with a correlation coefficient (R) of 0.159 and weighted average of 83.2%, a difference of 0.42%.
In Labor Force | Age 35-44 Correlation Summary
| Measurement | Tsimshian | Delaware |
| Minimum | 57.1% | 44.4% |
| Maximum | 100.0% | 100.0% |
| Range | 42.9% | 55.6% |
| Mean | 80.2% | 81.5% |
| Median | 83.6% | 83.2% |
| Interquartile 25% (IQ1) | 71.6% | 77.8% |
| Interquartile 75% (IQ3) | 86.8% | 87.9% |
| Interquartile Range (IQR) | 15.2% | 10.1% |
| Standard Deviation (Sample) | 11.9% | 11.8% |
| Standard Deviation (Population) | 11.5% | 11.8% |
Demographics Similar to Tsimshian and Delaware by In Labor Force | Age 35-44
In terms of in labor force | age 35-44, the demographic groups most similar to Tsimshian are Basque (83.6%, a difference of 0.020%), Immigrants from El Salvador (83.5%, a difference of 0.020%), Vietnamese (83.5%, a difference of 0.030%), Immigrants from Dominica (83.5%, a difference of 0.040%), and Immigrants from Congo (83.5%, a difference of 0.040%). Similarly, the demographic groups most similar to Delaware are Hawaiian (83.2%, a difference of 0.010%), Samoan (83.2%, a difference of 0.010%), Nonimmigrants (83.2%, a difference of 0.030%), Immigrants from Fiji (83.2%, a difference of 0.040%), and Spanish (83.2%, a difference of 0.040%).
| Demographics | Rating | Rank | In Labor Force | Age 35-44 |
| Basques | 0.3 /100 | #257 | Tragic 83.6% |
| Tsimshian | 0.2 /100 | #258 | Tragic 83.5% |
| Immigrants | El Salvador | 0.2 /100 | #259 | Tragic 83.5% |
| Vietnamese | 0.2 /100 | #260 | Tragic 83.5% |
| Immigrants | Dominica | 0.2 /100 | #261 | Tragic 83.5% |
| Immigrants | Congo | 0.2 /100 | #262 | Tragic 83.5% |
| Iroquois | 0.2 /100 | #263 | Tragic 83.5% |
| Scotch-Irish | 0.1 /100 | #264 | Tragic 83.5% |
| Central Americans | 0.1 /100 | #265 | Tragic 83.5% |
| Spaniards | 0.1 /100 | #266 | Tragic 83.4% |
| Guamanians/Chamorros | 0.1 /100 | #267 | Tragic 83.4% |
| Hondurans | 0.1 /100 | #268 | Tragic 83.4% |
| Immigrants | Grenada | 0.1 /100 | #269 | Tragic 83.3% |
| Immigrants | Honduras | 0.0 /100 | #270 | Tragic 83.3% |
| French American Indians | 0.0 /100 | #271 | Tragic 83.2% |
| Immigrants | Fiji | 0.0 /100 | #272 | Tragic 83.2% |
| Spanish | 0.0 /100 | #273 | Tragic 83.2% |
| Immigrants | Nonimmigrants | 0.0 /100 | #274 | Tragic 83.2% |
| Hawaiians | 0.0 /100 | #275 | Tragic 83.2% |
| Delaware | 0.0 /100 | #276 | Tragic 83.2% |
| Samoans | 0.0 /100 | #277 | Tragic 83.2% |