Trinidadian and Tobagonian vs Japanese 6th Grade
COMPARE
Trinidadian and Tobagonian
Japanese
6th Grade
6th Grade Comparison
Trinidadians and Tobagonians
Japanese
96.2%
6TH GRADE
0.1/ 100
METRIC RATING
281st/ 347
METRIC RANK
95.4%
6TH GRADE
0.0/ 100
METRIC RATING
316th/ 347
METRIC RANK
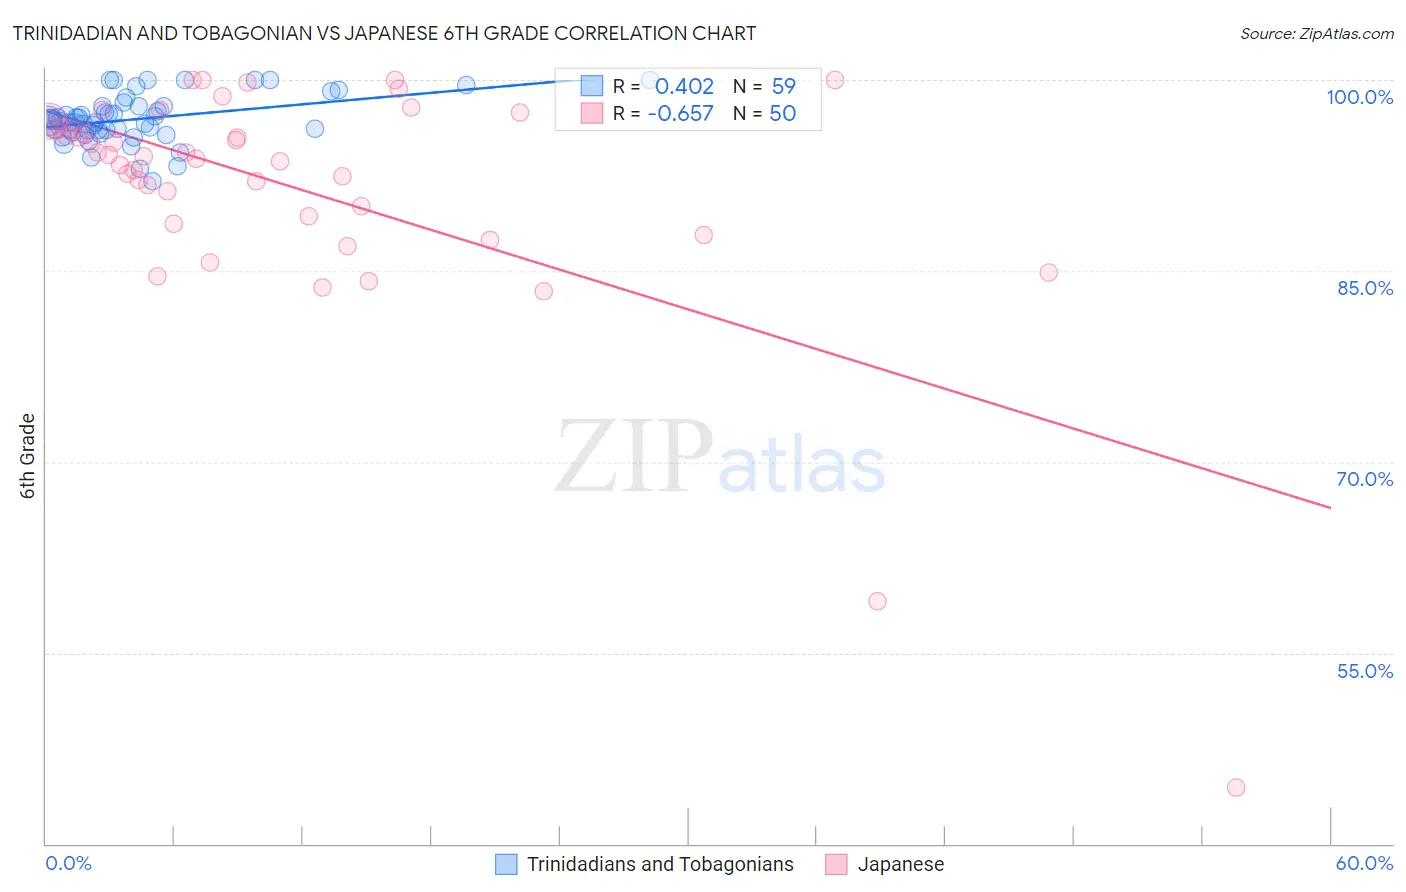
Trinidadian and Tobagonian vs Japanese 6th Grade Correlation Chart
The statistical analysis conducted on geographies consisting of 219,882,819 people shows a moderate positive correlation between the proportion of Trinidadians and Tobagonians and percentage of population with at least 6th grade education in the United States with a correlation coefficient (R) of 0.402 and weighted average of 96.2%. Similarly, the statistical analysis conducted on geographies consisting of 249,183,224 people shows a significant negative correlation between the proportion of Japanese and percentage of population with at least 6th grade education in the United States with a correlation coefficient (R) of -0.657 and weighted average of 95.4%, a difference of 0.92%.
6th Grade Correlation Summary
| Measurement | Trinidadian and Tobagonian | Japanese |
| Minimum | 92.1% | 44.4% |
| Maximum | 100.0% | 100.0% |
| Range | 7.9% | 55.6% |
| Mean | 96.9% | 91.7% |
| Median | 96.8% | 94.0% |
| Interquartile 25% (IQ1) | 96.0% | 89.3% |
| Interquartile 75% (IQ3) | 97.9% | 96.2% |
| Interquartile Range (IQR) | 1.9% | 6.9% |
| Standard Deviation (Sample) | 1.8% | 9.6% |
| Standard Deviation (Population) | 1.8% | 9.5% |
Similar Demographics by 6th Grade
Demographics Similar to Trinidadians and Tobagonians by 6th Grade
In terms of 6th grade, the demographic groups most similar to Trinidadians and Tobagonians are Immigrants from Peru (96.2%, a difference of 0.0%), Immigrants from Afghanistan (96.2%, a difference of 0.0%), Houma (96.2%, a difference of 0.0%), Cuban (96.2%, a difference of 0.010%), and Immigrants from Western Africa (96.3%, a difference of 0.020%).
| Demographics | Rating | Rank | 6th Grade |
| Immigrants | Philippines | 0.1 /100 | #274 | Tragic 96.3% |
| Immigrants | Ghana | 0.1 /100 | #275 | Tragic 96.3% |
| Yaqui | 0.1 /100 | #276 | Tragic 96.3% |
| Immigrants | Western Africa | 0.1 /100 | #277 | Tragic 96.3% |
| Immigrants | Thailand | 0.1 /100 | #278 | Tragic 96.3% |
| Immigrants | Peru | 0.1 /100 | #279 | Tragic 96.2% |
| Immigrants | Afghanistan | 0.1 /100 | #280 | Tragic 96.2% |
| Trinidadians and Tobagonians | 0.1 /100 | #281 | Tragic 96.2% |
| Houma | 0.1 /100 | #282 | Tragic 96.2% |
| Cubans | 0.1 /100 | #283 | Tragic 96.2% |
| Fijians | 0.1 /100 | #284 | Tragic 96.2% |
| Somalis | 0.1 /100 | #285 | Tragic 96.2% |
| Barbadians | 0.0 /100 | #286 | Tragic 96.2% |
| Immigrants | Trinidad and Tobago | 0.0 /100 | #287 | Tragic 96.2% |
| Malaysians | 0.0 /100 | #288 | Tragic 96.2% |
Demographics Similar to Japanese by 6th Grade
In terms of 6th grade, the demographic groups most similar to Japanese are Immigrants from Bangladesh (95.4%, a difference of 0.010%), Immigrants from Vietnam (95.4%, a difference of 0.020%), Nicaraguan (95.4%, a difference of 0.030%), Vietnamese (95.3%, a difference of 0.030%), and Belizean (95.3%, a difference of 0.060%).
| Demographics | Rating | Rank | 6th Grade |
| Puerto Ricans | 0.0 /100 | #309 | Tragic 95.5% |
| Ecuadorians | 0.0 /100 | #310 | Tragic 95.5% |
| Immigrants | Portugal | 0.0 /100 | #311 | Tragic 95.5% |
| Immigrants | Guyana | 0.0 /100 | #312 | Tragic 95.5% |
| Nicaraguans | 0.0 /100 | #313 | Tragic 95.4% |
| Immigrants | Vietnam | 0.0 /100 | #314 | Tragic 95.4% |
| Immigrants | Bangladesh | 0.0 /100 | #315 | Tragic 95.4% |
| Japanese | 0.0 /100 | #316 | Tragic 95.4% |
| Vietnamese | 0.0 /100 | #317 | Tragic 95.3% |
| Belizeans | 0.0 /100 | #318 | Tragic 95.3% |
| Immigrants | Belize | 0.0 /100 | #319 | Tragic 95.3% |
| Immigrants | Ecuador | 0.0 /100 | #320 | Tragic 95.3% |
| Immigrants | Fiji | 0.0 /100 | #321 | Tragic 95.2% |
| Immigrants | Cambodia | 0.0 /100 | #322 | Tragic 95.2% |
| Central American Indians | 0.0 /100 | #323 | Tragic 95.1% |