Trinidadian and Tobagonian vs Assyrian/Chaldean/Syriac Single Male Poverty
COMPARE
Trinidadian and Tobagonian
Assyrian/Chaldean/Syriac
Single Male Poverty
Single Male Poverty Comparison
Trinidadians and Tobagonians
Assyrians/Chaldeans/Syriacs
13.0%
SINGLE MALE POVERTY
21.4/ 100
METRIC RATING
201st/ 347
METRIC RANK
9.8%
SINGLE MALE POVERTY
100.0/ 100
METRIC RATING
1st/ 347
METRIC RANK
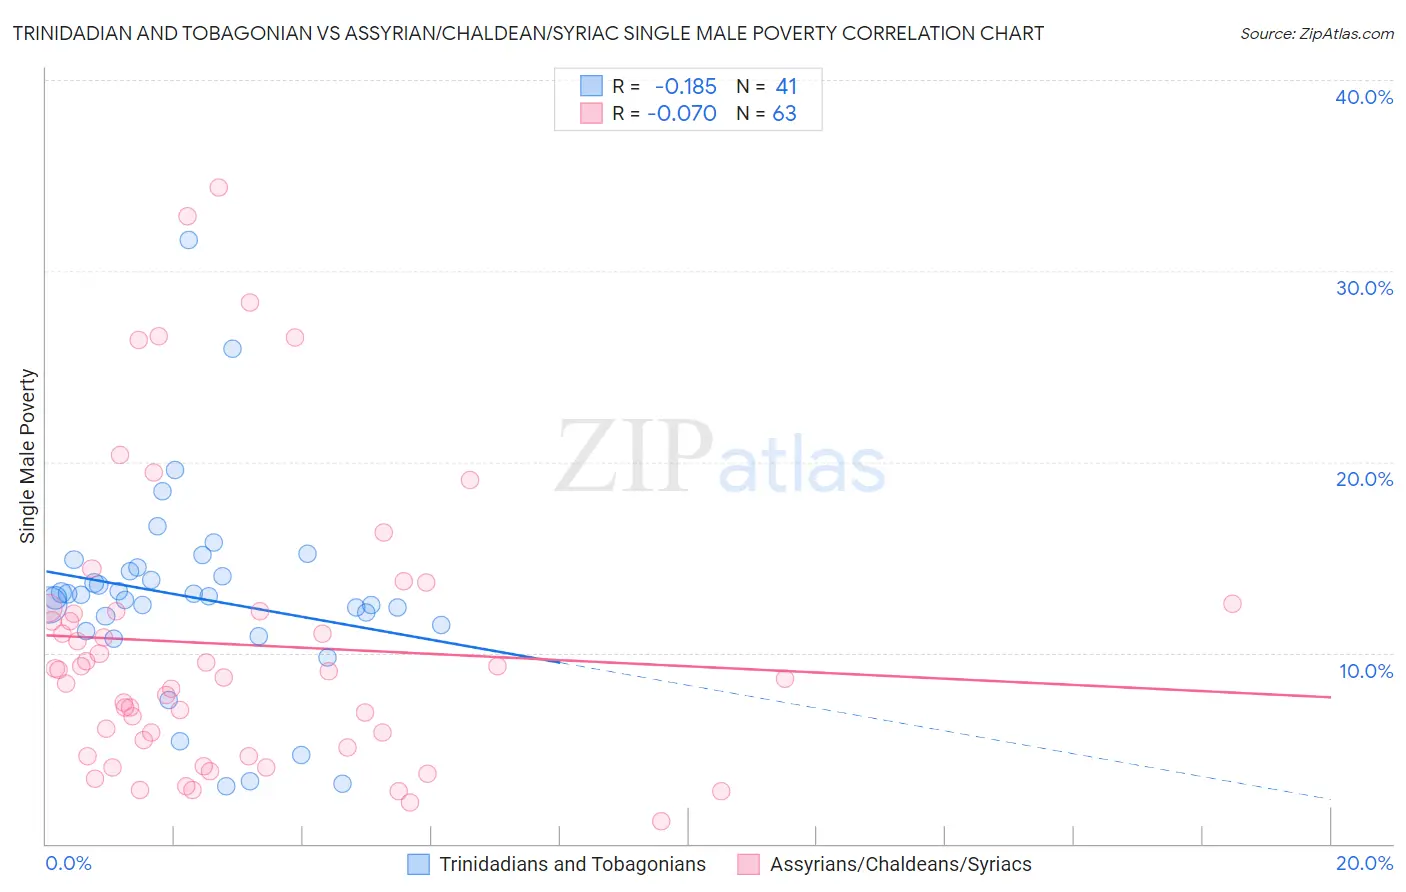
Trinidadian and Tobagonian vs Assyrian/Chaldean/Syriac Single Male Poverty Correlation Chart
The statistical analysis conducted on geographies consisting of 204,213,293 people shows a poor negative correlation between the proportion of Trinidadians and Tobagonians and poverty level among single males in the United States with a correlation coefficient (R) of -0.185 and weighted average of 13.0%. Similarly, the statistical analysis conducted on geographies consisting of 104,209,222 people shows a slight negative correlation between the proportion of Assyrians/Chaldeans/Syriacs and poverty level among single males in the United States with a correlation coefficient (R) of -0.070 and weighted average of 9.8%, a difference of 33.4%.
Single Male Poverty Correlation Summary
| Measurement | Trinidadian and Tobagonian | Assyrian/Chaldean/Syriac |
| Minimum | 3.0% | 1.2% |
| Maximum | 31.6% | 34.4% |
| Range | 28.6% | 33.2% |
| Mean | 12.9% | 10.4% |
| Median | 13.0% | 9.1% |
| Interquartile 25% (IQ1) | 11.3% | 5.0% |
| Interquartile 75% (IQ3) | 14.4% | 12.2% |
| Interquartile Range (IQR) | 3.1% | 7.2% |
| Standard Deviation (Sample) | 5.3% | 7.5% |
| Standard Deviation (Population) | 5.2% | 7.5% |
Similar Demographics by Single Male Poverty
Demographics Similar to Trinidadians and Tobagonians by Single Male Poverty
In terms of single male poverty, the demographic groups most similar to Trinidadians and Tobagonians are Slovene (13.0%, a difference of 0.010%), Immigrants from Norway (13.0%, a difference of 0.030%), Lithuanian (13.0%, a difference of 0.050%), Basque (13.0%, a difference of 0.060%), and Immigrants from Bangladesh (13.0%, a difference of 0.090%).
| Demographics | Rating | Rank | Single Male Poverty |
| Liberians | 25.2 /100 | #194 | Fair 13.0% |
| Immigrants | England | 23.4 /100 | #195 | Fair 13.0% |
| Immigrants | Grenada | 23.1 /100 | #196 | Fair 13.0% |
| Immigrants | Laos | 23.1 /100 | #197 | Fair 13.0% |
| Lithuanians | 22.1 /100 | #198 | Fair 13.0% |
| Immigrants | Norway | 21.8 /100 | #199 | Fair 13.0% |
| Slovenes | 21.6 /100 | #200 | Fair 13.0% |
| Trinidadians and Tobagonians | 21.4 /100 | #201 | Fair 13.0% |
| Basques | 20.7 /100 | #202 | Fair 13.0% |
| Immigrants | Bangladesh | 20.4 /100 | #203 | Fair 13.0% |
| Estonians | 20.3 /100 | #204 | Fair 13.0% |
| Poles | 19.3 /100 | #205 | Poor 13.0% |
| Northern Europeans | 18.9 /100 | #206 | Poor 13.0% |
| Sudanese | 17.7 /100 | #207 | Poor 13.1% |
| Immigrants | Western Africa | 17.6 /100 | #208 | Poor 13.1% |
Demographics Similar to Assyrians/Chaldeans/Syriacs by Single Male Poverty
In terms of single male poverty, the demographic groups most similar to Assyrians/Chaldeans/Syriacs are Immigrants from Taiwan (10.3%, a difference of 5.3%), Immigrants from India (10.3%, a difference of 6.0%), Immigrants from Hong Kong (10.4%, a difference of 7.0%), Tongan (10.5%, a difference of 7.1%), and Filipino (10.6%, a difference of 8.9%).
| Demographics | Rating | Rank | Single Male Poverty |
| Assyrians/Chaldeans/Syriacs | 100.0 /100 | #1 | Exceptional 9.8% |
| Immigrants | Taiwan | 100.0 /100 | #2 | Exceptional 10.3% |
| Immigrants | India | 100.0 /100 | #3 | Exceptional 10.3% |
| Immigrants | Hong Kong | 100.0 /100 | #4 | Exceptional 10.4% |
| Tongans | 100.0 /100 | #5 | Exceptional 10.5% |
| Filipinos | 100.0 /100 | #6 | Exceptional 10.6% |
| Afghans | 100.0 /100 | #7 | Exceptional 10.7% |
| Thais | 100.0 /100 | #8 | Exceptional 10.8% |
| Taiwanese | 100.0 /100 | #9 | Exceptional 10.9% |
| Immigrants | Fiji | 100.0 /100 | #10 | Exceptional 10.9% |
| Immigrants | Philippines | 100.0 /100 | #11 | Exceptional 10.9% |
| Immigrants | Afghanistan | 100.0 /100 | #12 | Exceptional 10.9% |
| Immigrants | South Central Asia | 100.0 /100 | #13 | Exceptional 10.9% |
| Chinese | 100.0 /100 | #14 | Exceptional 11.0% |
| Koreans | 100.0 /100 | #15 | Exceptional 11.0% |