Immigrants from Senegal vs Assyrian/Chaldean/Syriac Single Male Poverty
COMPARE
Immigrants from Senegal
Assyrian/Chaldean/Syriac
Single Male Poverty
Single Male Poverty Comparison
Immigrants from Senegal
Assyrians/Chaldeans/Syriacs
13.5%
SINGLE MALE POVERTY
1.7/ 100
METRIC RATING
244th/ 347
METRIC RANK
9.8%
SINGLE MALE POVERTY
100.0/ 100
METRIC RATING
1st/ 347
METRIC RANK
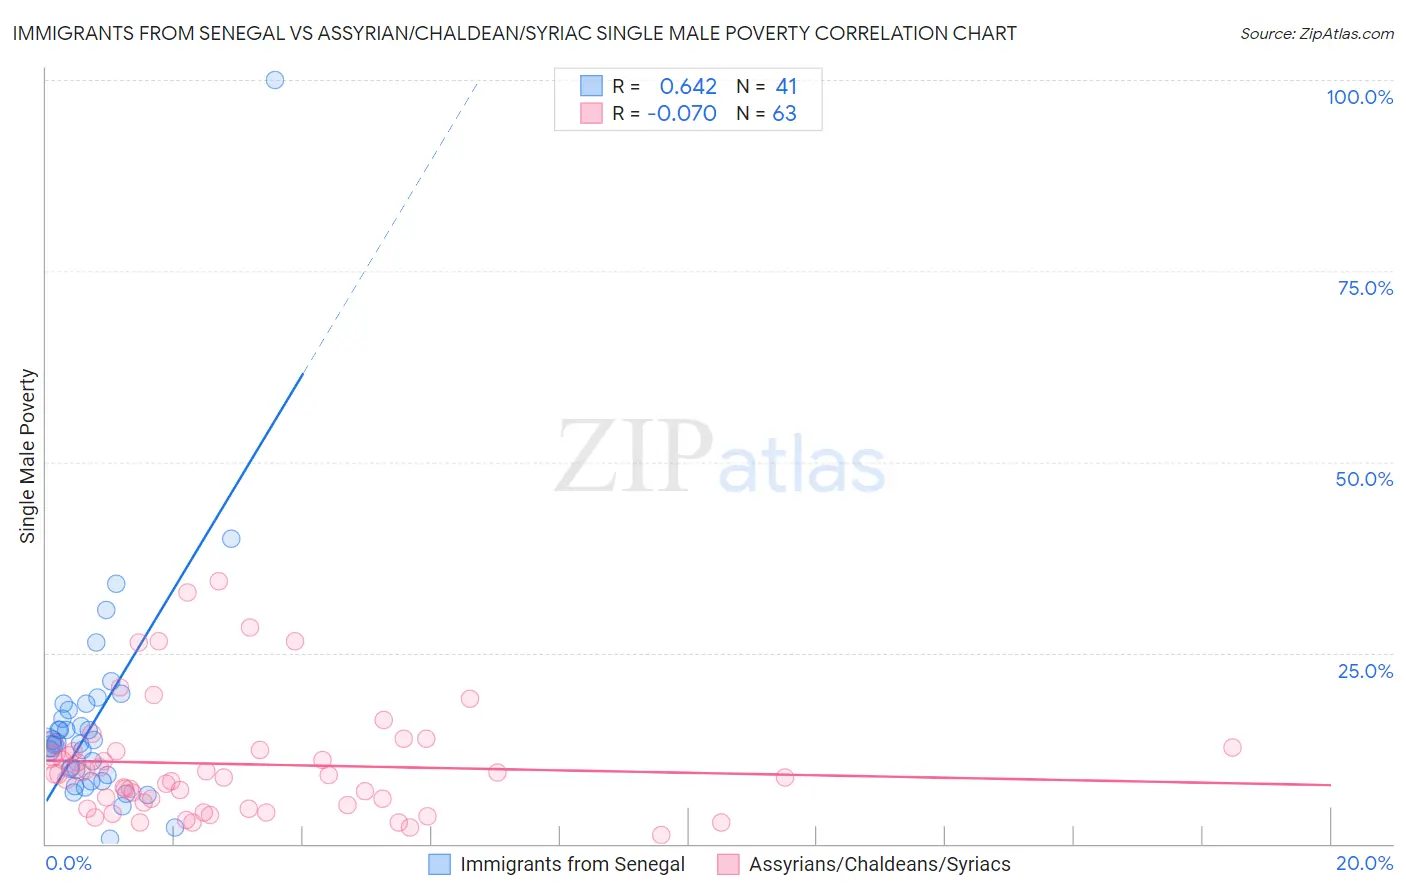
Immigrants from Senegal vs Assyrian/Chaldean/Syriac Single Male Poverty Correlation Chart
The statistical analysis conducted on geographies consisting of 87,233,263 people shows a significant positive correlation between the proportion of Immigrants from Senegal and poverty level among single males in the United States with a correlation coefficient (R) of 0.642 and weighted average of 13.5%. Similarly, the statistical analysis conducted on geographies consisting of 104,209,222 people shows a slight negative correlation between the proportion of Assyrians/Chaldeans/Syriacs and poverty level among single males in the United States with a correlation coefficient (R) of -0.070 and weighted average of 9.8%, a difference of 38.2%.
Single Male Poverty Correlation Summary
| Measurement | Immigrants from Senegal | Assyrian/Chaldean/Syriac |
| Minimum | 0.68% | 1.2% |
| Maximum | 100.0% | 34.4% |
| Range | 99.3% | 33.2% |
| Mean | 16.1% | 10.4% |
| Median | 13.2% | 9.1% |
| Interquartile 25% (IQ1) | 8.6% | 5.0% |
| Interquartile 75% (IQ3) | 17.9% | 12.2% |
| Interquartile Range (IQR) | 9.3% | 7.2% |
| Standard Deviation (Sample) | 15.6% | 7.5% |
| Standard Deviation (Population) | 15.4% | 7.5% |
Similar Demographics by Single Male Poverty
Demographics Similar to Immigrants from Senegal by Single Male Poverty
In terms of single male poverty, the demographic groups most similar to Immigrants from Senegal are Immigrants from Latin America (13.5%, a difference of 0.26%), Barbadian (13.4%, a difference of 0.28%), Carpatho Rusyn (13.4%, a difference of 0.32%), Immigrants from Germany (13.4%, a difference of 0.33%), and Immigrants from Micronesia (13.5%, a difference of 0.36%).
| Demographics | Rating | Rank | Single Male Poverty |
| British West Indians | 3.4 /100 | #237 | Tragic 13.4% |
| Immigrants | Ghana | 3.2 /100 | #238 | Tragic 13.4% |
| Czechoslovakians | 3.0 /100 | #239 | Tragic 13.4% |
| Belizeans | 2.3 /100 | #240 | Tragic 13.4% |
| Immigrants | Germany | 2.1 /100 | #241 | Tragic 13.4% |
| Carpatho Rusyns | 2.1 /100 | #242 | Tragic 13.4% |
| Barbadians | 2.1 /100 | #243 | Tragic 13.4% |
| Immigrants | Senegal | 1.7 /100 | #244 | Tragic 13.5% |
| Immigrants | Latin America | 1.3 /100 | #245 | Tragic 13.5% |
| Immigrants | Micronesia | 1.2 /100 | #246 | Tragic 13.5% |
| Belgians | 1.2 /100 | #247 | Tragic 13.5% |
| Czechs | 1.2 /100 | #248 | Tragic 13.5% |
| Spanish | 1.0 /100 | #249 | Tragic 13.6% |
| Immigrants | Somalia | 1.0 /100 | #250 | Tragic 13.6% |
| Immigrants | Zaire | 0.9 /100 | #251 | Tragic 13.6% |
Demographics Similar to Assyrians/Chaldeans/Syriacs by Single Male Poverty
In terms of single male poverty, the demographic groups most similar to Assyrians/Chaldeans/Syriacs are Immigrants from Taiwan (10.3%, a difference of 5.3%), Immigrants from India (10.3%, a difference of 6.0%), Immigrants from Hong Kong (10.4%, a difference of 7.0%), Tongan (10.5%, a difference of 7.1%), and Filipino (10.6%, a difference of 8.9%).
| Demographics | Rating | Rank | Single Male Poverty |
| Assyrians/Chaldeans/Syriacs | 100.0 /100 | #1 | Exceptional 9.8% |
| Immigrants | Taiwan | 100.0 /100 | #2 | Exceptional 10.3% |
| Immigrants | India | 100.0 /100 | #3 | Exceptional 10.3% |
| Immigrants | Hong Kong | 100.0 /100 | #4 | Exceptional 10.4% |
| Tongans | 100.0 /100 | #5 | Exceptional 10.5% |
| Filipinos | 100.0 /100 | #6 | Exceptional 10.6% |
| Afghans | 100.0 /100 | #7 | Exceptional 10.7% |
| Thais | 100.0 /100 | #8 | Exceptional 10.8% |
| Taiwanese | 100.0 /100 | #9 | Exceptional 10.9% |
| Immigrants | Fiji | 100.0 /100 | #10 | Exceptional 10.9% |
| Immigrants | Philippines | 100.0 /100 | #11 | Exceptional 10.9% |
| Immigrants | Afghanistan | 100.0 /100 | #12 | Exceptional 10.9% |
| Immigrants | South Central Asia | 100.0 /100 | #13 | Exceptional 10.9% |
| Chinese | 100.0 /100 | #14 | Exceptional 11.0% |
| Koreans | 100.0 /100 | #15 | Exceptional 11.0% |