Trinidadian and Tobagonian vs Assyrian/Chaldean/Syriac In Labor Force | Age 20-64
COMPARE
Trinidadian and Tobagonian
Assyrian/Chaldean/Syriac
In Labor Force | Age 20-64
In Labor Force | Age 20-64 Comparison
Trinidadians and Tobagonians
Assyrians/Chaldeans/Syriacs
79.0%
IN LABOR FORCE | AGE 20-64
2.3/ 100
METRIC RATING
240th/ 347
METRIC RANK
79.4%
IN LABOR FORCE | AGE 20-64
33.3/ 100
METRIC RATING
187th/ 347
METRIC RANK
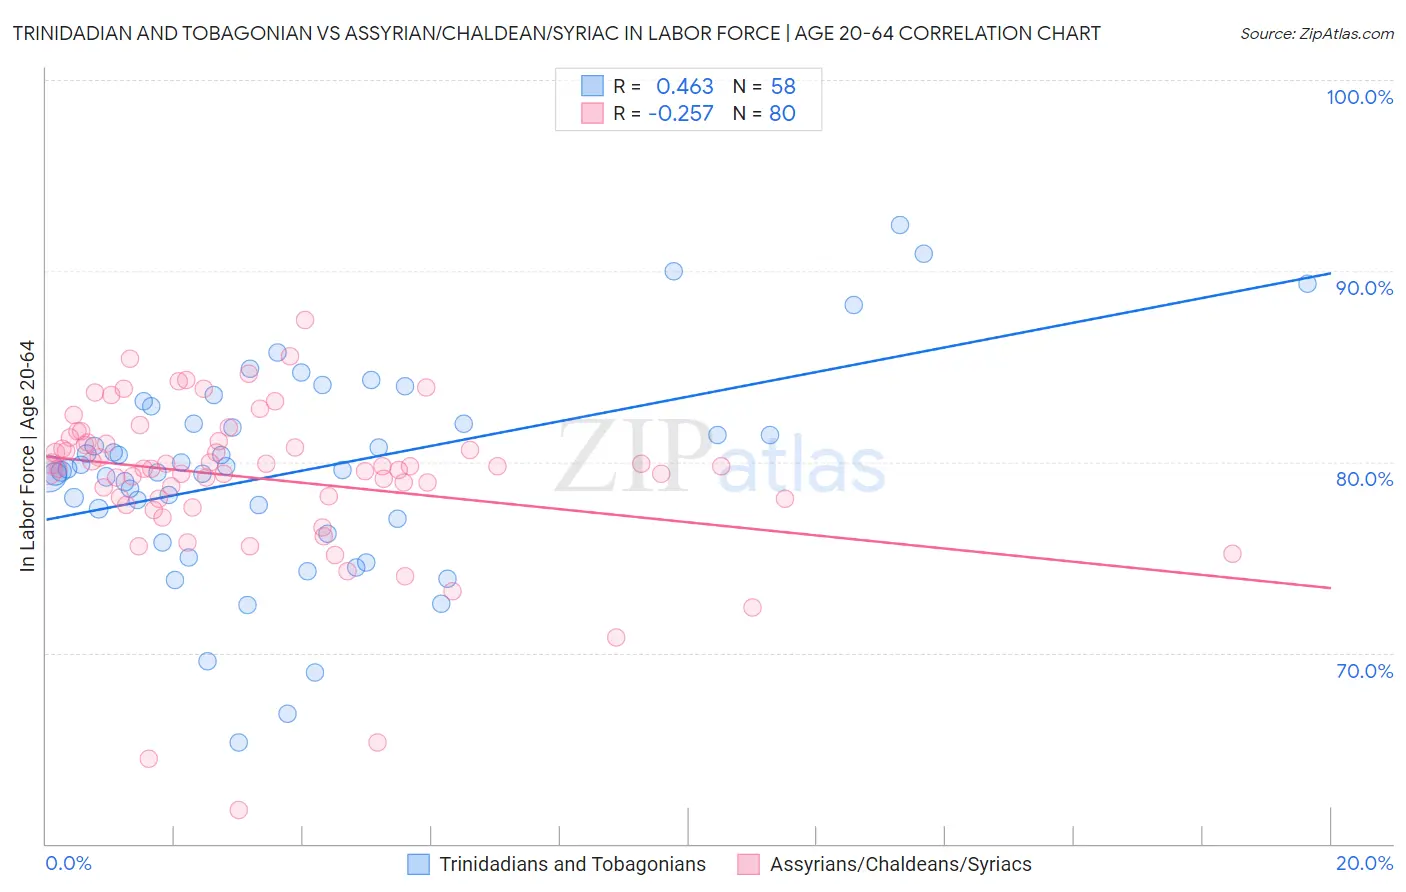
Trinidadian and Tobagonian vs Assyrian/Chaldean/Syriac In Labor Force | Age 20-64 Correlation Chart
The statistical analysis conducted on geographies consisting of 219,883,468 people shows a moderate positive correlation between the proportion of Trinidadians and Tobagonians and labor force participation rate among population between the ages 20 and 64 in the United States with a correlation coefficient (R) of 0.463 and weighted average of 79.0%. Similarly, the statistical analysis conducted on geographies consisting of 110,318,125 people shows a weak negative correlation between the proportion of Assyrians/Chaldeans/Syriacs and labor force participation rate among population between the ages 20 and 64 in the United States with a correlation coefficient (R) of -0.257 and weighted average of 79.4%, a difference of 0.62%.
In Labor Force | Age 20-64 Correlation Summary
| Measurement | Trinidadian and Tobagonian | Assyrian/Chaldean/Syriac |
| Minimum | 65.3% | 61.8% |
| Maximum | 92.4% | 87.4% |
| Range | 27.1% | 25.6% |
| Mean | 79.5% | 79.1% |
| Median | 79.6% | 79.7% |
| Interquartile 25% (IQ1) | 77.0% | 78.1% |
| Interquartile 75% (IQ3) | 82.0% | 81.0% |
| Interquartile Range (IQR) | 5.0% | 2.9% |
| Standard Deviation (Sample) | 5.4% | 4.3% |
| Standard Deviation (Population) | 5.4% | 4.3% |
Similar Demographics by In Labor Force | Age 20-64
Demographics Similar to Trinidadians and Tobagonians by In Labor Force | Age 20-64
In terms of in labor force | age 20-64, the demographic groups most similar to Trinidadians and Tobagonians are Welsh (79.0%, a difference of 0.010%), Immigrants from Jamaica (79.0%, a difference of 0.020%), Jamaican (78.9%, a difference of 0.030%), Immigrants from North America (79.0%, a difference of 0.040%), and Immigrants from Micronesia (78.9%, a difference of 0.040%).
| Demographics | Rating | Rank | In Labor Force | Age 20-64 |
| Japanese | 4.0 /100 | #233 | Tragic 79.1% |
| Immigrants | Canada | 3.2 /100 | #234 | Tragic 79.0% |
| Tlingit-Haida | 3.2 /100 | #235 | Tragic 79.0% |
| Samoans | 2.9 /100 | #236 | Tragic 79.0% |
| Immigrants | North America | 2.9 /100 | #237 | Tragic 79.0% |
| Immigrants | Jamaica | 2.6 /100 | #238 | Tragic 79.0% |
| Welsh | 2.4 /100 | #239 | Tragic 79.0% |
| Trinidadians and Tobagonians | 2.3 /100 | #240 | Tragic 79.0% |
| Jamaicans | 2.0 /100 | #241 | Tragic 78.9% |
| Immigrants | Micronesia | 1.9 /100 | #242 | Tragic 78.9% |
| Immigrants | West Indies | 1.7 /100 | #243 | Tragic 78.9% |
| French | 1.5 /100 | #244 | Tragic 78.9% |
| Scottish | 1.3 /100 | #245 | Tragic 78.9% |
| Immigrants | Trinidad and Tobago | 1.1 /100 | #246 | Tragic 78.8% |
| Immigrants | Germany | 1.0 /100 | #247 | Tragic 78.8% |
Demographics Similar to Assyrians/Chaldeans/Syriacs by In Labor Force | Age 20-64
In terms of in labor force | age 20-64, the demographic groups most similar to Assyrians/Chaldeans/Syriacs are Israeli (79.5%, a difference of 0.010%), Northern European (79.5%, a difference of 0.010%), Immigrants from Haiti (79.4%, a difference of 0.010%), Finnish (79.5%, a difference of 0.020%), and Immigrants from El Salvador (79.4%, a difference of 0.020%).
| Demographics | Rating | Rank | In Labor Force | Age 20-64 |
| Salvadorans | 41.0 /100 | #180 | Average 79.5% |
| Immigrants | Saudi Arabia | 37.7 /100 | #181 | Fair 79.5% |
| Malaysians | 37.1 /100 | #182 | Fair 79.5% |
| Immigrants | Hungary | 36.8 /100 | #183 | Fair 79.5% |
| Finns | 35.9 /100 | #184 | Fair 79.5% |
| Israelis | 34.7 /100 | #185 | Fair 79.5% |
| Northern Europeans | 34.5 /100 | #186 | Fair 79.5% |
| Assyrians/Chaldeans/Syriacs | 33.3 /100 | #187 | Fair 79.4% |
| Immigrants | Haiti | 32.1 /100 | #188 | Fair 79.4% |
| Immigrants | El Salvador | 30.9 /100 | #189 | Fair 79.4% |
| Immigrants | Syria | 30.8 /100 | #190 | Fair 79.4% |
| Swiss | 28.9 /100 | #191 | Fair 79.4% |
| Immigrants | Denmark | 26.9 /100 | #192 | Fair 79.4% |
| Indonesians | 26.1 /100 | #193 | Fair 79.4% |
| Immigrants | Thailand | 24.8 /100 | #194 | Fair 79.4% |