Iraqi vs Assyrian/Chaldean/Syriac Single Male Poverty
COMPARE
Iraqi
Assyrian/Chaldean/Syriac
Single Male Poverty
Single Male Poverty Comparison
Iraqis
Assyrians/Chaldeans/Syriacs
12.3%
SINGLE MALE POVERTY
95.1/ 100
METRIC RATING
107th/ 347
METRIC RANK
9.8%
SINGLE MALE POVERTY
100.0/ 100
METRIC RATING
1st/ 347
METRIC RANK
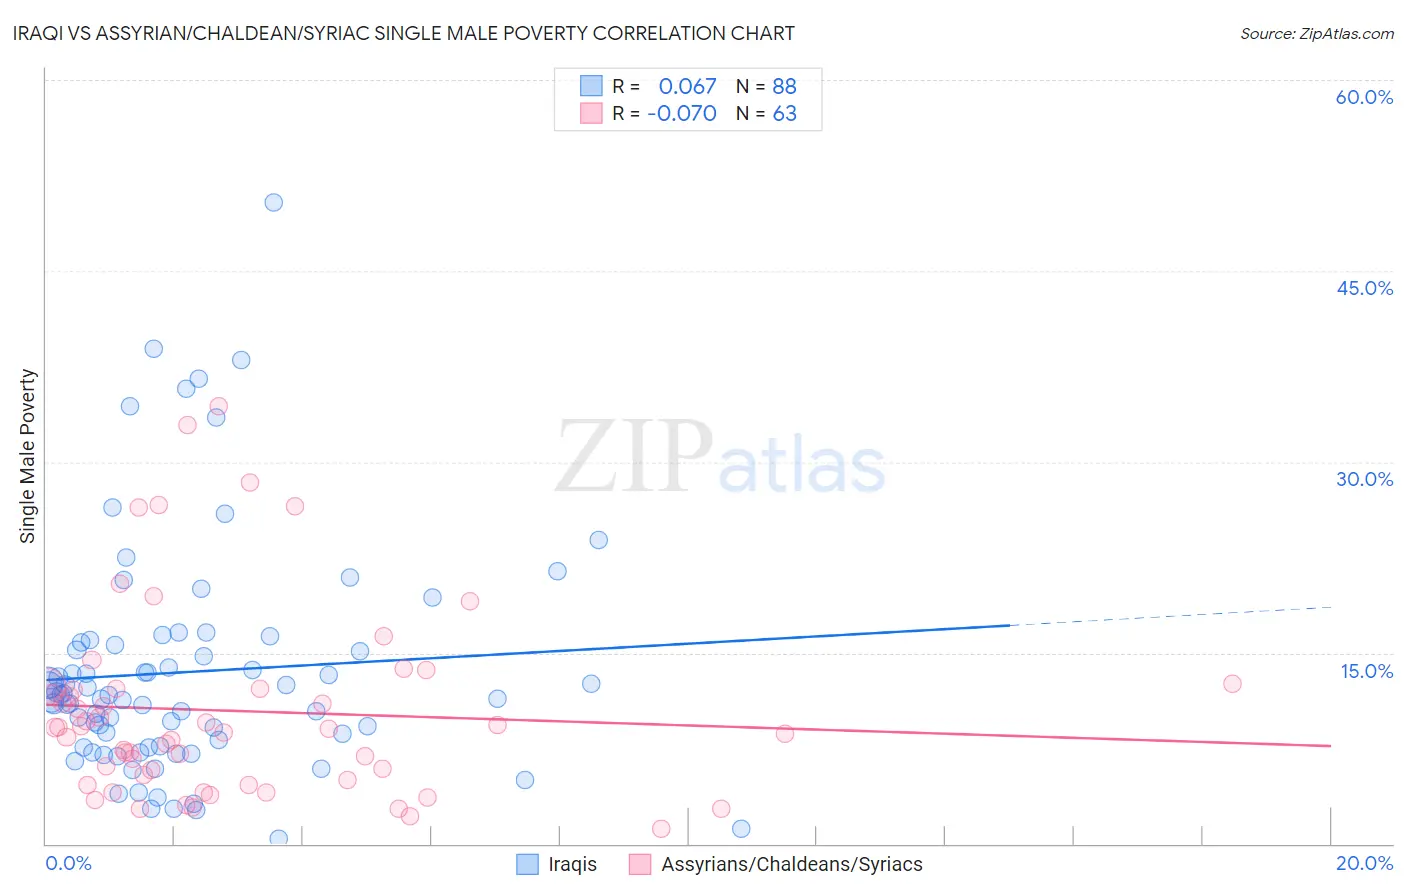
Iraqi vs Assyrian/Chaldean/Syriac Single Male Poverty Correlation Chart
The statistical analysis conducted on geographies consisting of 160,224,189 people shows a slight positive correlation between the proportion of Iraqis and poverty level among single males in the United States with a correlation coefficient (R) of 0.067 and weighted average of 12.3%. Similarly, the statistical analysis conducted on geographies consisting of 104,209,222 people shows a slight negative correlation between the proportion of Assyrians/Chaldeans/Syriacs and poverty level among single males in the United States with a correlation coefficient (R) of -0.070 and weighted average of 9.8%, a difference of 26.0%.
Single Male Poverty Correlation Summary
| Measurement | Iraqi | Assyrian/Chaldean/Syriac |
| Minimum | 0.42% | 1.2% |
| Maximum | 50.4% | 34.4% |
| Range | 50.0% | 33.2% |
| Mean | 13.5% | 10.4% |
| Median | 11.5% | 9.1% |
| Interquartile 25% (IQ1) | 7.6% | 5.0% |
| Interquartile 75% (IQ3) | 15.7% | 12.2% |
| Interquartile Range (IQR) | 8.1% | 7.2% |
| Standard Deviation (Sample) | 9.1% | 7.5% |
| Standard Deviation (Population) | 9.1% | 7.5% |
Similar Demographics by Single Male Poverty
Demographics Similar to Iraqis by Single Male Poverty
In terms of single male poverty, the demographic groups most similar to Iraqis are Immigrants from Eastern Africa (12.3%, a difference of 0.020%), Ugandan (12.3%, a difference of 0.15%), Immigrants from Morocco (12.3%, a difference of 0.18%), Jordanian (12.3%, a difference of 0.26%), and Immigrants from Portugal (12.3%, a difference of 0.38%).
| Demographics | Rating | Rank | Single Male Poverty |
| Immigrants | Australia | 97.1 /100 | #100 | Exceptional 12.2% |
| Immigrants | Latvia | 97.0 /100 | #101 | Exceptional 12.2% |
| Immigrants | Europe | 97.0 /100 | #102 | Exceptional 12.2% |
| Immigrants | Armenia | 96.7 /100 | #103 | Exceptional 12.2% |
| Immigrants | Kazakhstan | 96.7 /100 | #104 | Exceptional 12.2% |
| Jordanians | 95.9 /100 | #105 | Exceptional 12.3% |
| Immigrants | Morocco | 95.6 /100 | #106 | Exceptional 12.3% |
| Iraqis | 95.1 /100 | #107 | Exceptional 12.3% |
| Immigrants | Eastern Africa | 95.0 /100 | #108 | Exceptional 12.3% |
| Ugandans | 94.5 /100 | #109 | Exceptional 12.3% |
| Immigrants | Portugal | 93.6 /100 | #110 | Exceptional 12.3% |
| Immigrants | North Macedonia | 93.6 /100 | #111 | Exceptional 12.3% |
| Kenyans | 93.3 /100 | #112 | Exceptional 12.4% |
| Pakistanis | 92.4 /100 | #113 | Exceptional 12.4% |
| Nicaraguans | 92.1 /100 | #114 | Exceptional 12.4% |
Demographics Similar to Assyrians/Chaldeans/Syriacs by Single Male Poverty
In terms of single male poverty, the demographic groups most similar to Assyrians/Chaldeans/Syriacs are Immigrants from Taiwan (10.3%, a difference of 5.3%), Immigrants from India (10.3%, a difference of 6.0%), Immigrants from Hong Kong (10.4%, a difference of 7.0%), Tongan (10.5%, a difference of 7.1%), and Filipino (10.6%, a difference of 8.9%).
| Demographics | Rating | Rank | Single Male Poverty |
| Assyrians/Chaldeans/Syriacs | 100.0 /100 | #1 | Exceptional 9.8% |
| Immigrants | Taiwan | 100.0 /100 | #2 | Exceptional 10.3% |
| Immigrants | India | 100.0 /100 | #3 | Exceptional 10.3% |
| Immigrants | Hong Kong | 100.0 /100 | #4 | Exceptional 10.4% |
| Tongans | 100.0 /100 | #5 | Exceptional 10.5% |
| Filipinos | 100.0 /100 | #6 | Exceptional 10.6% |
| Afghans | 100.0 /100 | #7 | Exceptional 10.7% |
| Thais | 100.0 /100 | #8 | Exceptional 10.8% |
| Taiwanese | 100.0 /100 | #9 | Exceptional 10.9% |
| Immigrants | Fiji | 100.0 /100 | #10 | Exceptional 10.9% |
| Immigrants | Philippines | 100.0 /100 | #11 | Exceptional 10.9% |
| Immigrants | Afghanistan | 100.0 /100 | #12 | Exceptional 10.9% |
| Immigrants | South Central Asia | 100.0 /100 | #13 | Exceptional 10.9% |
| Chinese | 100.0 /100 | #14 | Exceptional 11.0% |
| Koreans | 100.0 /100 | #15 | Exceptional 11.0% |