Trinidadian and Tobagonian vs Immigrants from Canada Single Male Poverty
COMPARE
Trinidadian and Tobagonian
Immigrants from Canada
Single Male Poverty
Single Male Poverty Comparison
Trinidadians and Tobagonians
Immigrants from Canada
13.0%
SINGLE MALE POVERTY
21.4/ 100
METRIC RATING
201st/ 347
METRIC RANK
12.8%
SINGLE MALE POVERTY
44.8/ 100
METRIC RATING
177th/ 347
METRIC RANK
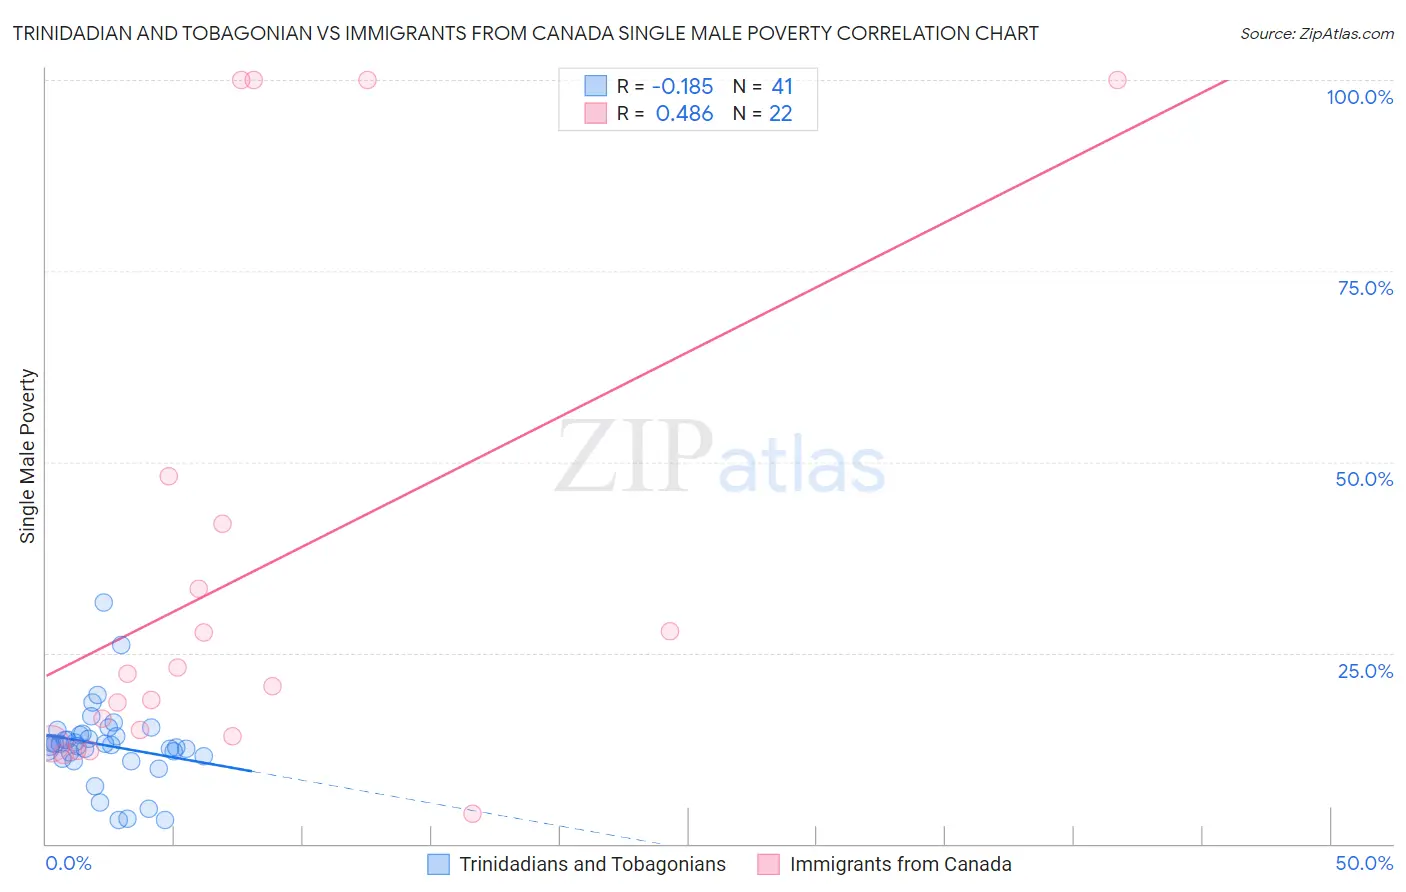
Trinidadian and Tobagonian vs Immigrants from Canada Single Male Poverty Correlation Chart
The statistical analysis conducted on geographies consisting of 204,213,293 people shows a poor negative correlation between the proportion of Trinidadians and Tobagonians and poverty level among single males in the United States with a correlation coefficient (R) of -0.185 and weighted average of 13.0%. Similarly, the statistical analysis conducted on geographies consisting of 395,473,582 people shows a moderate positive correlation between the proportion of Immigrants from Canada and poverty level among single males in the United States with a correlation coefficient (R) of 0.486 and weighted average of 12.8%, a difference of 1.4%.
Single Male Poverty Correlation Summary
| Measurement | Trinidadian and Tobagonian | Immigrants from Canada |
| Minimum | 3.0% | 4.0% |
| Maximum | 31.6% | 100.0% |
| Range | 28.6% | 96.0% |
| Mean | 12.9% | 35.5% |
| Median | 13.0% | 21.5% |
| Interquartile 25% (IQ1) | 11.3% | 14.1% |
| Interquartile 75% (IQ3) | 14.4% | 41.9% |
| Interquartile Range (IQR) | 3.1% | 27.8% |
| Standard Deviation (Sample) | 5.3% | 32.7% |
| Standard Deviation (Population) | 5.2% | 32.0% |
Similar Demographics by Single Male Poverty
Demographics Similar to Trinidadians and Tobagonians by Single Male Poverty
In terms of single male poverty, the demographic groups most similar to Trinidadians and Tobagonians are Slovene (13.0%, a difference of 0.010%), Immigrants from Norway (13.0%, a difference of 0.030%), Lithuanian (13.0%, a difference of 0.050%), Basque (13.0%, a difference of 0.060%), and Immigrants from Bangladesh (13.0%, a difference of 0.090%).
| Demographics | Rating | Rank | Single Male Poverty |
| Liberians | 25.2 /100 | #194 | Fair 13.0% |
| Immigrants | England | 23.4 /100 | #195 | Fair 13.0% |
| Immigrants | Grenada | 23.1 /100 | #196 | Fair 13.0% |
| Immigrants | Laos | 23.1 /100 | #197 | Fair 13.0% |
| Lithuanians | 22.1 /100 | #198 | Fair 13.0% |
| Immigrants | Norway | 21.8 /100 | #199 | Fair 13.0% |
| Slovenes | 21.6 /100 | #200 | Fair 13.0% |
| Trinidadians and Tobagonians | 21.4 /100 | #201 | Fair 13.0% |
| Basques | 20.7 /100 | #202 | Fair 13.0% |
| Immigrants | Bangladesh | 20.4 /100 | #203 | Fair 13.0% |
| Estonians | 20.3 /100 | #204 | Fair 13.0% |
| Poles | 19.3 /100 | #205 | Poor 13.0% |
| Northern Europeans | 18.9 /100 | #206 | Poor 13.0% |
| Sudanese | 17.7 /100 | #207 | Poor 13.1% |
| Immigrants | Western Africa | 17.6 /100 | #208 | Poor 13.1% |
Demographics Similar to Immigrants from Canada by Single Male Poverty
In terms of single male poverty, the demographic groups most similar to Immigrants from Canada are Immigrants from Switzerland (12.8%, a difference of 0.090%), Syrian (12.8%, a difference of 0.19%), Israeli (12.9%, a difference of 0.20%), Croatian (12.8%, a difference of 0.22%), and Costa Rican (12.8%, a difference of 0.28%).
| Demographics | Rating | Rank | Single Male Poverty |
| Guyanese | 52.0 /100 | #170 | Average 12.8% |
| South Africans | 51.5 /100 | #171 | Average 12.8% |
| Danes | 51.4 /100 | #172 | Average 12.8% |
| Immigrants | St. Vincent and the Grenadines | 50.9 /100 | #173 | Average 12.8% |
| Costa Ricans | 50.0 /100 | #174 | Average 12.8% |
| Croatians | 48.9 /100 | #175 | Average 12.8% |
| Syrians | 48.4 /100 | #176 | Average 12.8% |
| Immigrants | Canada | 44.8 /100 | #177 | Average 12.8% |
| Immigrants | Switzerland | 43.1 /100 | #178 | Average 12.8% |
| Israelis | 41.0 /100 | #179 | Average 12.9% |
| Immigrants | North America | 37.7 /100 | #180 | Fair 12.9% |
| Panamanians | 37.6 /100 | #181 | Fair 12.9% |
| Moroccans | 36.8 /100 | #182 | Fair 12.9% |
| Immigrants | West Indies | 33.0 /100 | #183 | Fair 12.9% |
| Immigrants | Trinidad and Tobago | 32.5 /100 | #184 | Fair 12.9% |