Trinidadian and Tobagonian vs Immigrants from Sweden Single Male Poverty
COMPARE
Trinidadian and Tobagonian
Immigrants from Sweden
Single Male Poverty
Single Male Poverty Comparison
Trinidadians and Tobagonians
Immigrants from Sweden
13.0%
SINGLE MALE POVERTY
21.4/ 100
METRIC RATING
201st/ 347
METRIC RANK
12.2%
SINGLE MALE POVERTY
97.5/ 100
METRIC RATING
96th/ 347
METRIC RANK
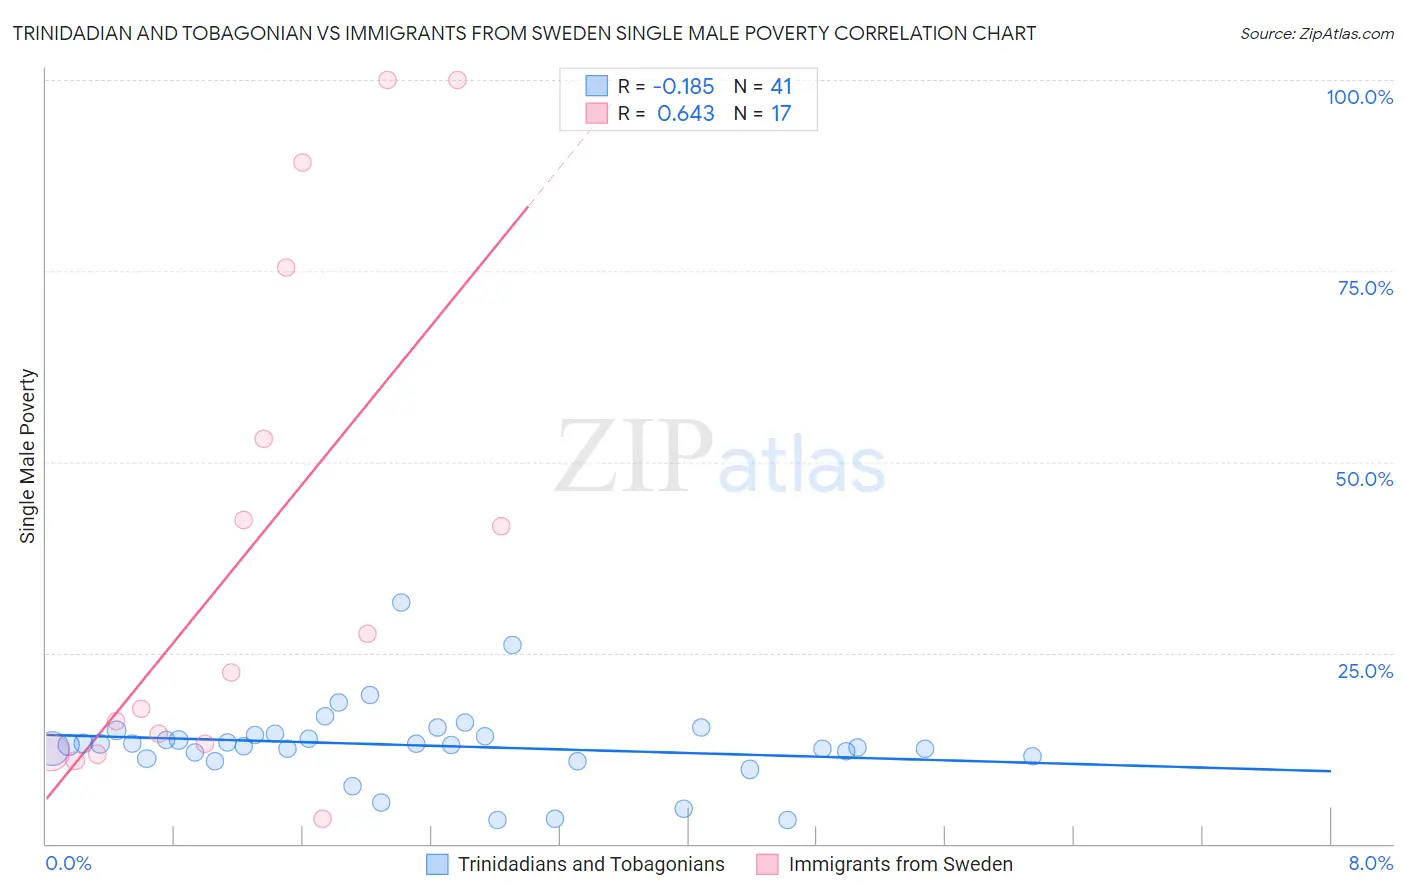
Trinidadian and Tobagonian vs Immigrants from Sweden Single Male Poverty Correlation Chart
The statistical analysis conducted on geographies consisting of 204,213,293 people shows a poor negative correlation between the proportion of Trinidadians and Tobagonians and poverty level among single males in the United States with a correlation coefficient (R) of -0.185 and weighted average of 13.0%. Similarly, the statistical analysis conducted on geographies consisting of 151,415,814 people shows a significant positive correlation between the proportion of Immigrants from Sweden and poverty level among single males in the United States with a correlation coefficient (R) of 0.643 and weighted average of 12.2%, a difference of 6.9%.
Single Male Poverty Correlation Summary
| Measurement | Trinidadian and Tobagonian | Immigrants from Sweden |
| Minimum | 3.0% | 3.3% |
| Maximum | 31.6% | 100.0% |
| Range | 28.6% | 96.7% |
| Mean | 12.9% | 38.3% |
| Median | 13.0% | 22.4% |
| Interquartile 25% (IQ1) | 11.3% | 12.5% |
| Interquartile 75% (IQ3) | 14.4% | 64.3% |
| Interquartile Range (IQR) | 3.1% | 51.7% |
| Standard Deviation (Sample) | 5.3% | 33.3% |
| Standard Deviation (Population) | 5.2% | 32.3% |
Similar Demographics by Single Male Poverty
Demographics Similar to Trinidadians and Tobagonians by Single Male Poverty
In terms of single male poverty, the demographic groups most similar to Trinidadians and Tobagonians are Slovene (13.0%, a difference of 0.010%), Immigrants from Norway (13.0%, a difference of 0.030%), Lithuanian (13.0%, a difference of 0.050%), Basque (13.0%, a difference of 0.060%), and Immigrants from Bangladesh (13.0%, a difference of 0.090%).
| Demographics | Rating | Rank | Single Male Poverty |
| Liberians | 25.2 /100 | #194 | Fair 13.0% |
| Immigrants | England | 23.4 /100 | #195 | Fair 13.0% |
| Immigrants | Grenada | 23.1 /100 | #196 | Fair 13.0% |
| Immigrants | Laos | 23.1 /100 | #197 | Fair 13.0% |
| Lithuanians | 22.1 /100 | #198 | Fair 13.0% |
| Immigrants | Norway | 21.8 /100 | #199 | Fair 13.0% |
| Slovenes | 21.6 /100 | #200 | Fair 13.0% |
| Trinidadians and Tobagonians | 21.4 /100 | #201 | Fair 13.0% |
| Basques | 20.7 /100 | #202 | Fair 13.0% |
| Immigrants | Bangladesh | 20.4 /100 | #203 | Fair 13.0% |
| Estonians | 20.3 /100 | #204 | Fair 13.0% |
| Poles | 19.3 /100 | #205 | Poor 13.0% |
| Northern Europeans | 18.9 /100 | #206 | Poor 13.0% |
| Sudanese | 17.7 /100 | #207 | Poor 13.1% |
| Immigrants | Western Africa | 17.6 /100 | #208 | Poor 13.1% |
Demographics Similar to Immigrants from Sweden by Single Male Poverty
In terms of single male poverty, the demographic groups most similar to Immigrants from Sweden are Immigrants from Italy (12.2%, a difference of 0.050%), Guamanian/Chamorro (12.2%, a difference of 0.050%), Immigrants from Cuba (12.2%, a difference of 0.090%), Mongolian (12.2%, a difference of 0.15%), and Colombian (12.2%, a difference of 0.16%).
| Demographics | Rating | Rank | Single Male Poverty |
| Immigrants | Ireland | 98.3 /100 | #89 | Exceptional 12.1% |
| South American Indians | 98.3 /100 | #90 | Exceptional 12.1% |
| Immigrants | Turkey | 98.2 /100 | #91 | Exceptional 12.1% |
| Spanish American Indians | 98.0 /100 | #92 | Exceptional 12.1% |
| Immigrants | Bosnia and Herzegovina | 97.9 /100 | #93 | Exceptional 12.1% |
| Colombians | 97.8 /100 | #94 | Exceptional 12.2% |
| Mongolians | 97.7 /100 | #95 | Exceptional 12.2% |
| Immigrants | Sweden | 97.5 /100 | #96 | Exceptional 12.2% |
| Immigrants | Italy | 97.4 /100 | #97 | Exceptional 12.2% |
| Guamanians/Chamorros | 97.4 /100 | #98 | Exceptional 12.2% |
| Immigrants | Cuba | 97.3 /100 | #99 | Exceptional 12.2% |
| Immigrants | Australia | 97.1 /100 | #100 | Exceptional 12.2% |
| Immigrants | Latvia | 97.0 /100 | #101 | Exceptional 12.2% |
| Immigrants | Europe | 97.0 /100 | #102 | Exceptional 12.2% |
| Immigrants | Armenia | 96.7 /100 | #103 | Exceptional 12.2% |