Tongan vs Immigrants from Uzbekistan Female Poverty
COMPARE
Tongan
Immigrants from Uzbekistan
Female Poverty
Female Poverty Comparison
Tongans
Immigrants from Uzbekistan
11.9%
FEMALE POVERTY
99.2/ 100
METRIC RATING
44th/ 347
METRIC RANK
14.4%
FEMALE POVERTY
4.4/ 100
METRIC RATING
218th/ 347
METRIC RANK
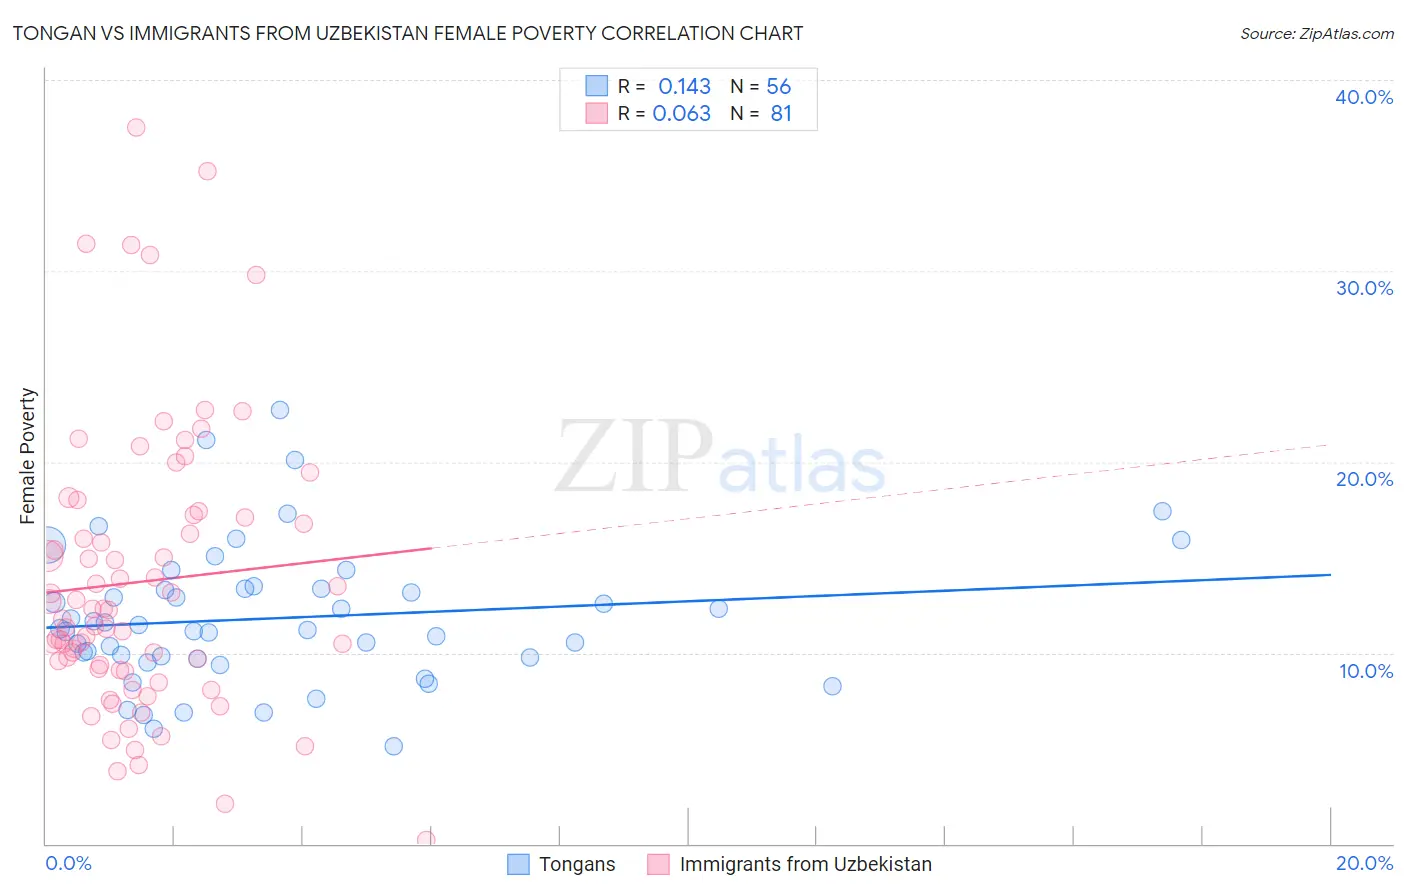
Tongan vs Immigrants from Uzbekistan Female Poverty Correlation Chart
The statistical analysis conducted on geographies consisting of 102,866,719 people shows a poor positive correlation between the proportion of Tongans and poverty level among females in the United States with a correlation coefficient (R) of 0.143 and weighted average of 11.9%. Similarly, the statistical analysis conducted on geographies consisting of 118,710,626 people shows a slight positive correlation between the proportion of Immigrants from Uzbekistan and poverty level among females in the United States with a correlation coefficient (R) of 0.063 and weighted average of 14.4%, a difference of 21.5%.
Female Poverty Correlation Summary
| Measurement | Tongan | Immigrants from Uzbekistan |
| Minimum | 5.1% | 0.21% |
| Maximum | 22.7% | 37.5% |
| Range | 17.6% | 37.3% |
| Mean | 11.8% | 13.7% |
| Median | 11.2% | 12.3% |
| Interquartile 25% (IQ1) | 9.7% | 9.1% |
| Interquartile 75% (IQ3) | 13.3% | 17.2% |
| Interquartile Range (IQR) | 3.6% | 8.0% |
| Standard Deviation (Sample) | 3.6% | 7.4% |
| Standard Deviation (Population) | 3.6% | 7.3% |
Similar Demographics by Female Poverty
Demographics Similar to Tongans by Female Poverty
In terms of female poverty, the demographic groups most similar to Tongans are Korean (11.9%, a difference of 0.070%), Immigrants from Czechoslovakia (11.9%, a difference of 0.090%), Turkish (11.9%, a difference of 0.10%), Czech (11.9%, a difference of 0.11%), and Immigrants from Moldova (11.9%, a difference of 0.11%).
| Demographics | Rating | Rank | Female Poverty |
| Immigrants | Greece | 99.3 /100 | #37 | Exceptional 11.8% |
| Russians | 99.3 /100 | #38 | Exceptional 11.8% |
| Immigrants | Poland | 99.3 /100 | #39 | Exceptional 11.8% |
| Macedonians | 99.3 /100 | #40 | Exceptional 11.8% |
| Czechs | 99.2 /100 | #41 | Exceptional 11.9% |
| Immigrants | Moldova | 99.2 /100 | #42 | Exceptional 11.9% |
| Koreans | 99.2 /100 | #43 | Exceptional 11.9% |
| Tongans | 99.2 /100 | #44 | Exceptional 11.9% |
| Immigrants | Czechoslovakia | 99.2 /100 | #45 | Exceptional 11.9% |
| Turks | 99.2 /100 | #46 | Exceptional 11.9% |
| Asians | 99.1 /100 | #47 | Exceptional 11.9% |
| Immigrants | Japan | 99.0 /100 | #48 | Exceptional 11.9% |
| Immigrants | Romania | 99.0 /100 | #49 | Exceptional 12.0% |
| Slovenes | 98.9 /100 | #50 | Exceptional 12.0% |
| Immigrants | Bulgaria | 98.9 /100 | #51 | Exceptional 12.0% |
Demographics Similar to Immigrants from Uzbekistan by Female Poverty
In terms of female poverty, the demographic groups most similar to Immigrants from Uzbekistan are Immigrants (14.4%, a difference of 0.050%), Immigrants from Thailand (14.4%, a difference of 0.080%), Japanese (14.5%, a difference of 0.14%), Immigrants from Panama (14.4%, a difference of 0.17%), and Alsatian (14.5%, a difference of 0.18%).
| Demographics | Rating | Rank | Female Poverty |
| Moroccans | 7.2 /100 | #211 | Tragic 14.3% |
| Bermudans | 5.5 /100 | #212 | Tragic 14.4% |
| Alaskan Athabascans | 5.3 /100 | #213 | Tragic 14.4% |
| Marshallese | 5.0 /100 | #214 | Tragic 14.4% |
| Immigrants | Panama | 4.7 /100 | #215 | Tragic 14.4% |
| Immigrants | Thailand | 4.5 /100 | #216 | Tragic 14.4% |
| Immigrants | Immigrants | 4.5 /100 | #217 | Tragic 14.4% |
| Immigrants | Uzbekistan | 4.4 /100 | #218 | Tragic 14.4% |
| Japanese | 4.1 /100 | #219 | Tragic 14.5% |
| Alsatians | 4.0 /100 | #220 | Tragic 14.5% |
| Immigrants | Cambodia | 3.7 /100 | #221 | Tragic 14.5% |
| Immigrants | Nonimmigrants | 3.7 /100 | #222 | Tragic 14.5% |
| Immigrants | Africa | 3.3 /100 | #223 | Tragic 14.5% |
| Americans | 2.8 /100 | #224 | Tragic 14.6% |
| Immigrants | Micronesia | 2.8 /100 | #225 | Tragic 14.6% |