Mexican American Indian vs Immigrants from Uzbekistan Female Poverty
COMPARE
Mexican American Indian
Immigrants from Uzbekistan
Female Poverty
Female Poverty Comparison
Mexican American Indians
Immigrants from Uzbekistan
15.6%
FEMALE POVERTY
0.1/ 100
METRIC RATING
262nd/ 347
METRIC RANK
14.4%
FEMALE POVERTY
4.4/ 100
METRIC RATING
218th/ 347
METRIC RANK
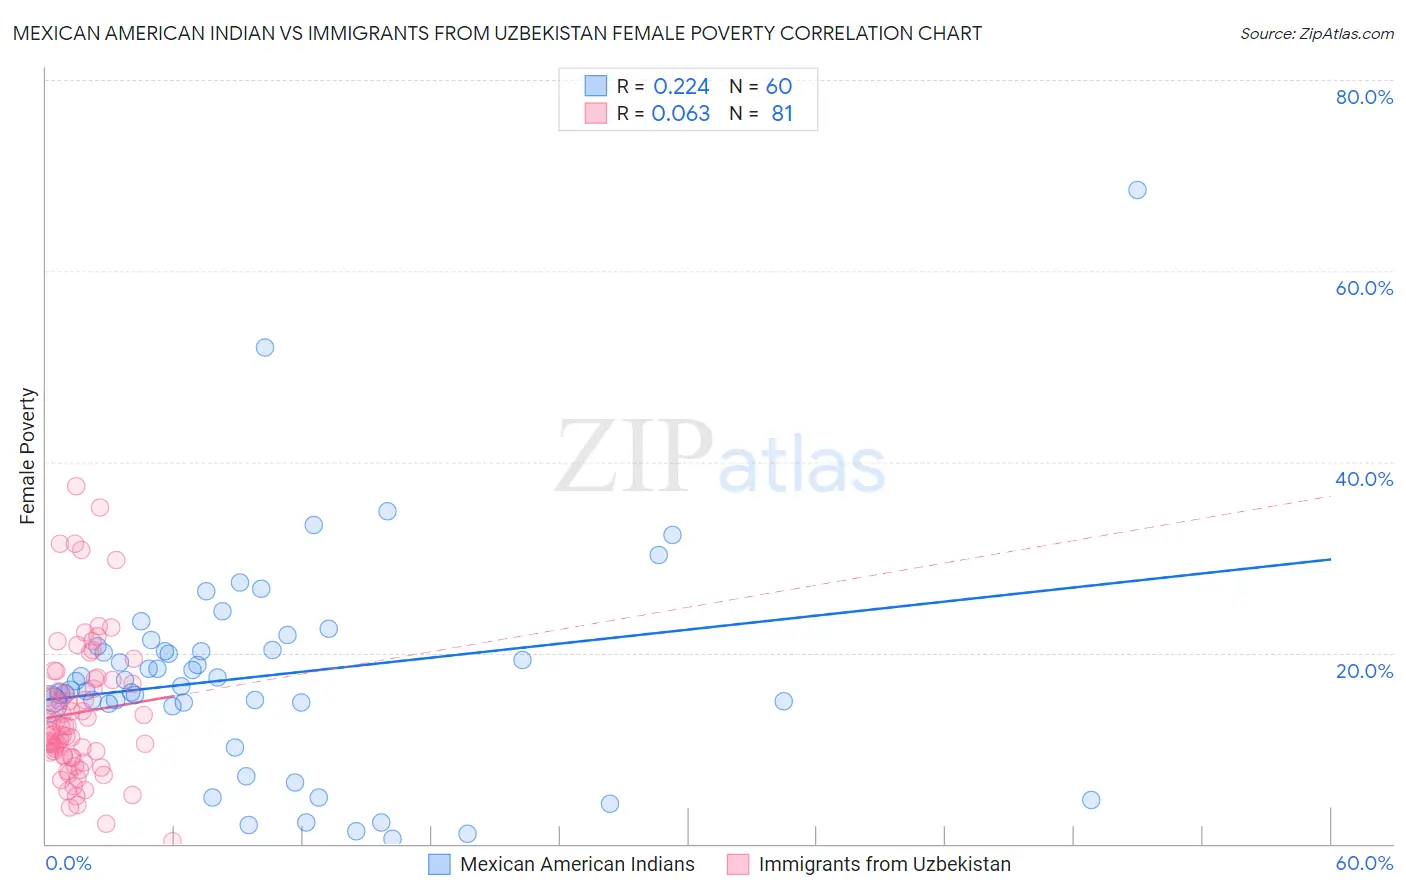
Mexican American Indian vs Immigrants from Uzbekistan Female Poverty Correlation Chart
The statistical analysis conducted on geographies consisting of 317,470,286 people shows a weak positive correlation between the proportion of Mexican American Indians and poverty level among females in the United States with a correlation coefficient (R) of 0.224 and weighted average of 15.6%. Similarly, the statistical analysis conducted on geographies consisting of 118,710,626 people shows a slight positive correlation between the proportion of Immigrants from Uzbekistan and poverty level among females in the United States with a correlation coefficient (R) of 0.063 and weighted average of 14.4%, a difference of 8.1%.
Female Poverty Correlation Summary
| Measurement | Mexican American Indian | Immigrants from Uzbekistan |
| Minimum | 0.49% | 0.21% |
| Maximum | 68.4% | 37.5% |
| Range | 67.9% | 37.3% |
| Mean | 17.6% | 13.7% |
| Median | 16.8% | 12.3% |
| Interquartile 25% (IQ1) | 14.7% | 9.1% |
| Interquartile 75% (IQ3) | 20.5% | 17.2% |
| Interquartile Range (IQR) | 5.8% | 8.0% |
| Standard Deviation (Sample) | 11.5% | 7.4% |
| Standard Deviation (Population) | 11.4% | 7.3% |
Similar Demographics by Female Poverty
Demographics Similar to Mexican American Indians by Female Poverty
In terms of female poverty, the demographic groups most similar to Mexican American Indians are Guyanese (15.6%, a difference of 0.0%), Cherokee (15.6%, a difference of 0.010%), Immigrants from Guyana (15.6%, a difference of 0.10%), Immigrants from Ecuador (15.6%, a difference of 0.14%), and Cape Verdean (15.6%, a difference of 0.18%).
| Demographics | Rating | Rank | Female Poverty |
| Ottawa | 0.2 /100 | #255 | Tragic 15.5% |
| Jamaicans | 0.2 /100 | #256 | Tragic 15.5% |
| Immigrants | Jamaica | 0.1 /100 | #257 | Tragic 15.6% |
| Shoshone | 0.1 /100 | #258 | Tragic 15.6% |
| Cape Verdeans | 0.1 /100 | #259 | Tragic 15.6% |
| Immigrants | Guyana | 0.1 /100 | #260 | Tragic 15.6% |
| Guyanese | 0.1 /100 | #261 | Tragic 15.6% |
| Mexican American Indians | 0.1 /100 | #262 | Tragic 15.6% |
| Cherokee | 0.1 /100 | #263 | Tragic 15.6% |
| Immigrants | Ecuador | 0.1 /100 | #264 | Tragic 15.6% |
| Immigrants | Liberia | 0.1 /100 | #265 | Tragic 15.7% |
| Immigrants | El Salvador | 0.1 /100 | #266 | Tragic 15.7% |
| Sub-Saharan Africans | 0.1 /100 | #267 | Tragic 15.8% |
| Immigrants | Nicaragua | 0.1 /100 | #268 | Tragic 15.8% |
| Iroquois | 0.1 /100 | #269 | Tragic 15.8% |
Demographics Similar to Immigrants from Uzbekistan by Female Poverty
In terms of female poverty, the demographic groups most similar to Immigrants from Uzbekistan are Immigrants (14.4%, a difference of 0.050%), Immigrants from Thailand (14.4%, a difference of 0.080%), Japanese (14.5%, a difference of 0.14%), Immigrants from Panama (14.4%, a difference of 0.17%), and Alsatian (14.5%, a difference of 0.18%).
| Demographics | Rating | Rank | Female Poverty |
| Moroccans | 7.2 /100 | #211 | Tragic 14.3% |
| Bermudans | 5.5 /100 | #212 | Tragic 14.4% |
| Alaskan Athabascans | 5.3 /100 | #213 | Tragic 14.4% |
| Marshallese | 5.0 /100 | #214 | Tragic 14.4% |
| Immigrants | Panama | 4.7 /100 | #215 | Tragic 14.4% |
| Immigrants | Thailand | 4.5 /100 | #216 | Tragic 14.4% |
| Immigrants | Immigrants | 4.5 /100 | #217 | Tragic 14.4% |
| Immigrants | Uzbekistan | 4.4 /100 | #218 | Tragic 14.4% |
| Japanese | 4.1 /100 | #219 | Tragic 14.5% |
| Alsatians | 4.0 /100 | #220 | Tragic 14.5% |
| Immigrants | Cambodia | 3.7 /100 | #221 | Tragic 14.5% |
| Immigrants | Nonimmigrants | 3.7 /100 | #222 | Tragic 14.5% |
| Immigrants | Africa | 3.3 /100 | #223 | Tragic 14.5% |
| Americans | 2.8 /100 | #224 | Tragic 14.6% |
| Immigrants | Micronesia | 2.8 /100 | #225 | Tragic 14.6% |