Tongan vs Immigrants from Uzbekistan Male Poverty
COMPARE
Tongan
Immigrants from Uzbekistan
Male Poverty
Male Poverty Comparison
Tongans
Immigrants from Uzbekistan
9.7%
MALE POVERTY
99.5/ 100
METRIC RATING
31st/ 347
METRIC RANK
12.2%
MALE POVERTY
2.6/ 100
METRIC RATING
215th/ 347
METRIC RANK
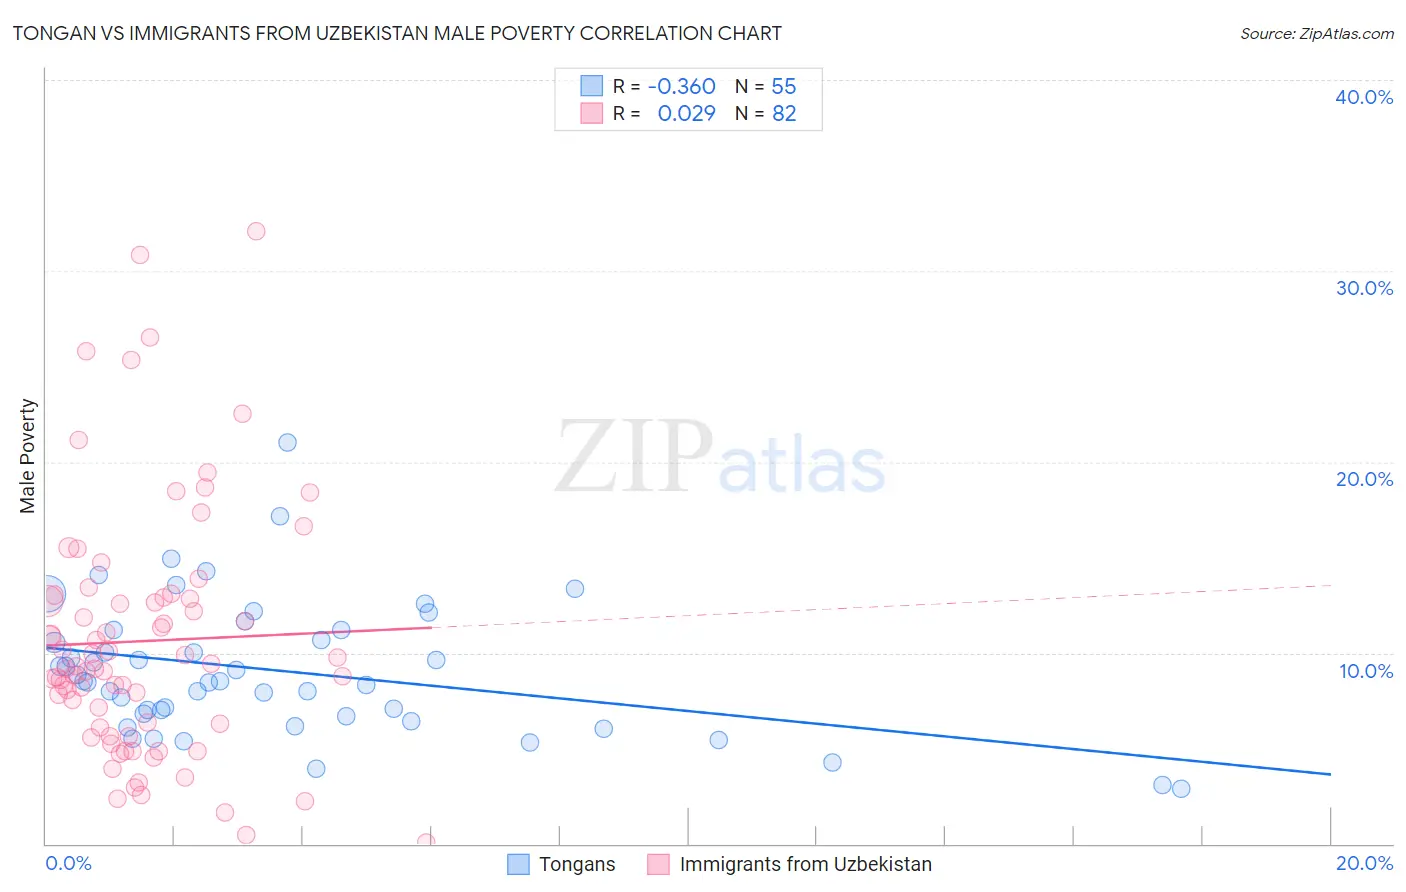
Tongan vs Immigrants from Uzbekistan Male Poverty Correlation Chart
The statistical analysis conducted on geographies consisting of 102,857,132 people shows a mild negative correlation between the proportion of Tongans and poverty level among males in the United States with a correlation coefficient (R) of -0.360 and weighted average of 9.7%. Similarly, the statistical analysis conducted on geographies consisting of 118,712,457 people shows no correlation between the proportion of Immigrants from Uzbekistan and poverty level among males in the United States with a correlation coefficient (R) of 0.029 and weighted average of 12.2%, a difference of 25.4%.
Male Poverty Correlation Summary
| Measurement | Tongan | Immigrants from Uzbekistan |
| Minimum | 2.9% | 0.066% |
| Maximum | 21.0% | 32.1% |
| Range | 18.2% | 32.0% |
| Mean | 9.1% | 10.6% |
| Median | 8.5% | 9.2% |
| Interquartile 25% (IQ1) | 6.7% | 6.1% |
| Interquartile 75% (IQ3) | 11.2% | 12.9% |
| Interquartile Range (IQR) | 4.5% | 6.9% |
| Standard Deviation (Sample) | 3.5% | 6.5% |
| Standard Deviation (Population) | 3.5% | 6.5% |
Similar Demographics by Male Poverty
Demographics Similar to Tongans by Male Poverty
In terms of male poverty, the demographic groups most similar to Tongans are Polish (9.7%, a difference of 0.020%), Greek (9.7%, a difference of 0.10%), Immigrants from Korea (9.7%, a difference of 0.14%), Macedonian (9.7%, a difference of 0.21%), and Danish (9.7%, a difference of 0.22%).
| Demographics | Rating | Rank | Male Poverty |
| Swedes | 99.7 /100 | #24 | Exceptional 9.6% |
| Eastern Europeans | 99.6 /100 | #25 | Exceptional 9.6% |
| Burmese | 99.6 /100 | #26 | Exceptional 9.7% |
| Danes | 99.6 /100 | #27 | Exceptional 9.7% |
| Immigrants | Korea | 99.6 /100 | #28 | Exceptional 9.7% |
| Greeks | 99.6 /100 | #29 | Exceptional 9.7% |
| Poles | 99.5 /100 | #30 | Exceptional 9.7% |
| Tongans | 99.5 /100 | #31 | Exceptional 9.7% |
| Macedonians | 99.5 /100 | #32 | Exceptional 9.7% |
| Immigrants | Northern Europe | 99.5 /100 | #33 | Exceptional 9.7% |
| Immigrants | Poland | 99.5 /100 | #34 | Exceptional 9.8% |
| Iranians | 99.4 /100 | #35 | Exceptional 9.8% |
| Czechs | 99.4 /100 | #36 | Exceptional 9.8% |
| Immigrants | Greece | 99.3 /100 | #37 | Exceptional 9.8% |
| Immigrants | Pakistan | 99.2 /100 | #38 | Exceptional 9.9% |
Demographics Similar to Immigrants from Uzbekistan by Male Poverty
In terms of male poverty, the demographic groups most similar to Immigrants from Uzbekistan are Immigrants from Cambodia (12.2%, a difference of 0.080%), Immigrants from Thailand (12.2%, a difference of 0.090%), German Russian (12.2%, a difference of 0.11%), Japanese (12.2%, a difference of 0.12%), and Bermudan (12.2%, a difference of 0.18%).
| Demographics | Rating | Rank | Male Poverty |
| Immigrants | Immigrants | 4.5 /100 | #208 | Tragic 12.0% |
| Immigrants | Azores | 4.3 /100 | #209 | Tragic 12.0% |
| Moroccans | 4.2 /100 | #210 | Tragic 12.0% |
| Immigrants | Panama | 4.0 /100 | #211 | Tragic 12.1% |
| Americans | 3.2 /100 | #212 | Tragic 12.1% |
| Immigrants | Nonimmigrants | 3.1 /100 | #213 | Tragic 12.1% |
| Japanese | 2.7 /100 | #214 | Tragic 12.2% |
| Immigrants | Uzbekistan | 2.6 /100 | #215 | Tragic 12.2% |
| Immigrants | Cambodia | 2.5 /100 | #216 | Tragic 12.2% |
| Immigrants | Thailand | 2.5 /100 | #217 | Tragic 12.2% |
| German Russians | 2.5 /100 | #218 | Tragic 12.2% |
| Bermudans | 2.4 /100 | #219 | Tragic 12.2% |
| Immigrants | Eritrea | 2.4 /100 | #220 | Tragic 12.2% |
| Ugandans | 2.2 /100 | #221 | Tragic 12.2% |
| Immigrants | Africa | 2.1 /100 | #222 | Tragic 12.2% |