Immigrants from Uzbekistan vs Immigrants from Armenia Female Poverty
COMPARE
Immigrants from Uzbekistan
Immigrants from Armenia
Female Poverty
Female Poverty Comparison
Immigrants from Uzbekistan
Immigrants from Armenia
14.4%
FEMALE POVERTY
4.4/ 100
METRIC RATING
218th/ 347
METRIC RANK
15.1%
FEMALE POVERTY
0.6/ 100
METRIC RATING
238th/ 347
METRIC RANK
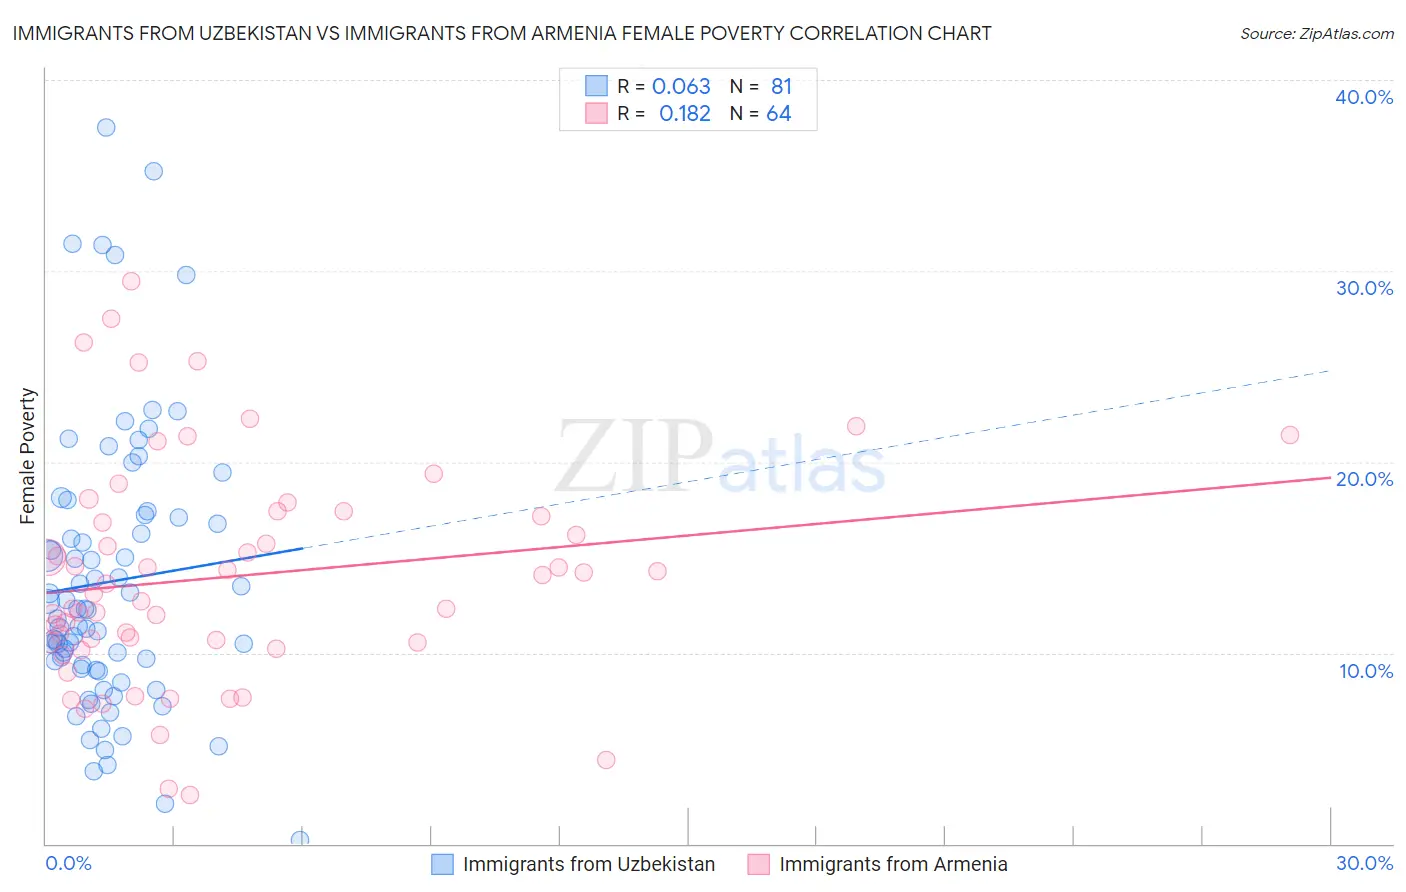
Immigrants from Uzbekistan vs Immigrants from Armenia Female Poverty Correlation Chart
The statistical analysis conducted on geographies consisting of 118,710,626 people shows a slight positive correlation between the proportion of Immigrants from Uzbekistan and poverty level among females in the United States with a correlation coefficient (R) of 0.063 and weighted average of 14.4%. Similarly, the statistical analysis conducted on geographies consisting of 97,710,578 people shows a poor positive correlation between the proportion of Immigrants from Armenia and poverty level among females in the United States with a correlation coefficient (R) of 0.182 and weighted average of 15.1%, a difference of 4.5%.
Female Poverty Correlation Summary
| Measurement | Immigrants from Uzbekistan | Immigrants from Armenia |
| Minimum | 0.21% | 2.5% |
| Maximum | 37.5% | 29.5% |
| Range | 37.3% | 26.9% |
| Mean | 13.7% | 14.0% |
| Median | 12.3% | 13.4% |
| Interquartile 25% (IQ1) | 9.1% | 10.5% |
| Interquartile 75% (IQ3) | 17.2% | 17.3% |
| Interquartile Range (IQR) | 8.0% | 6.7% |
| Standard Deviation (Sample) | 7.4% | 5.8% |
| Standard Deviation (Population) | 7.3% | 5.8% |
Demographics Similar to Immigrants from Uzbekistan and Immigrants from Armenia by Female Poverty
In terms of female poverty, the demographic groups most similar to Immigrants from Uzbekistan are Japanese (14.5%, a difference of 0.14%), Alsatian (14.5%, a difference of 0.18%), Immigrants from Cambodia (14.5%, a difference of 0.38%), Nonimmigrants (14.5%, a difference of 0.40%), and Immigrants from Africa (14.5%, a difference of 0.63%). Similarly, the demographic groups most similar to Immigrants from Armenia are French American Indian (15.1%, a difference of 0.080%), Cree (15.1%, a difference of 0.26%), Immigrants from Laos (15.0%, a difference of 0.90%), Fijian (14.9%, a difference of 1.3%), and Immigrants from Saudi Arabia (14.8%, a difference of 1.9%).
| Demographics | Rating | Rank | Female Poverty |
| Immigrants | Uzbekistan | 4.4 /100 | #218 | Tragic 14.4% |
| Japanese | 4.1 /100 | #219 | Tragic 14.5% |
| Alsatians | 4.0 /100 | #220 | Tragic 14.5% |
| Immigrants | Cambodia | 3.7 /100 | #221 | Tragic 14.5% |
| Immigrants | Nonimmigrants | 3.7 /100 | #222 | Tragic 14.5% |
| Immigrants | Africa | 3.3 /100 | #223 | Tragic 14.5% |
| Americans | 2.8 /100 | #224 | Tragic 14.6% |
| Immigrants | Micronesia | 2.8 /100 | #225 | Tragic 14.6% |
| Immigrants | Eritrea | 2.4 /100 | #226 | Tragic 14.6% |
| Immigrants | Nigeria | 2.1 /100 | #227 | Tragic 14.7% |
| German Russians | 2.0 /100 | #228 | Tragic 14.7% |
| Ghanaians | 1.9 /100 | #229 | Tragic 14.7% |
| Alaska Natives | 1.8 /100 | #230 | Tragic 14.7% |
| Nigerians | 1.7 /100 | #231 | Tragic 14.8% |
| Osage | 1.5 /100 | #232 | Tragic 14.8% |
| Immigrants | Saudi Arabia | 1.4 /100 | #233 | Tragic 14.8% |
| Fijians | 1.1 /100 | #234 | Tragic 14.9% |
| Immigrants | Laos | 0.9 /100 | #235 | Tragic 15.0% |
| Cree | 0.7 /100 | #236 | Tragic 15.1% |
| French American Indians | 0.6 /100 | #237 | Tragic 15.1% |
| Immigrants | Armenia | 0.6 /100 | #238 | Tragic 15.1% |