Kiowa vs Immigrants from Armenia Female Poverty
COMPARE
Kiowa
Immigrants from Armenia
Female Poverty
Female Poverty Comparison
Kiowa
Immigrants from Armenia
18.6%
FEMALE POVERTY
0.0/ 100
METRIC RATING
329th/ 347
METRIC RANK
15.1%
FEMALE POVERTY
0.6/ 100
METRIC RATING
238th/ 347
METRIC RANK
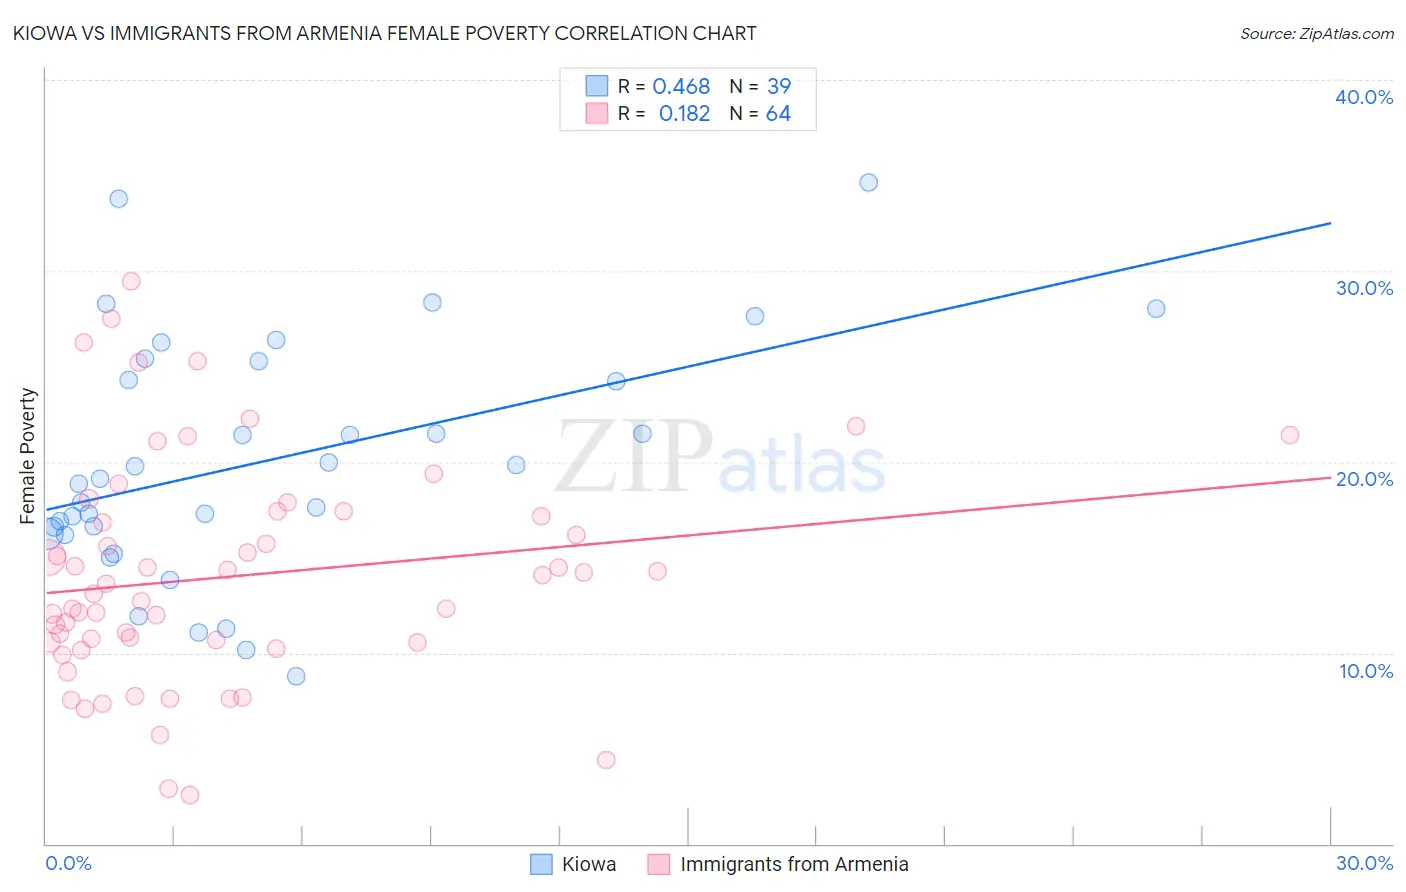
Kiowa vs Immigrants from Armenia Female Poverty Correlation Chart
The statistical analysis conducted on geographies consisting of 56,097,884 people shows a moderate positive correlation between the proportion of Kiowa and poverty level among females in the United States with a correlation coefficient (R) of 0.468 and weighted average of 18.6%. Similarly, the statistical analysis conducted on geographies consisting of 97,710,578 people shows a poor positive correlation between the proportion of Immigrants from Armenia and poverty level among females in the United States with a correlation coefficient (R) of 0.182 and weighted average of 15.1%, a difference of 23.3%.
Female Poverty Correlation Summary
| Measurement | Kiowa | Immigrants from Armenia |
| Minimum | 8.8% | 2.5% |
| Maximum | 34.7% | 29.5% |
| Range | 25.9% | 26.9% |
| Mean | 20.1% | 14.0% |
| Median | 19.1% | 13.4% |
| Interquartile 25% (IQ1) | 16.3% | 10.5% |
| Interquartile 75% (IQ3) | 25.2% | 17.3% |
| Interquartile Range (IQR) | 9.0% | 6.7% |
| Standard Deviation (Sample) | 6.2% | 5.8% |
| Standard Deviation (Population) | 6.1% | 5.8% |
Similar Demographics by Female Poverty
Demographics Similar to Kiowa by Female Poverty
In terms of female poverty, the demographic groups most similar to Kiowa are Black/African American (18.6%, a difference of 0.12%), Dominican (19.1%, a difference of 2.7%), Yakama (18.0%, a difference of 3.1%), Native/Alaskan (19.2%, a difference of 3.2%), and Central American Indian (18.0%, a difference of 3.2%).
| Demographics | Rating | Rank | Female Poverty |
| Menominee | 0.0 /100 | #322 | Tragic 17.6% |
| Paiute | 0.0 /100 | #323 | Tragic 17.7% |
| Immigrants | Honduras | 0.0 /100 | #324 | Tragic 17.7% |
| Colville | 0.0 /100 | #325 | Tragic 17.8% |
| Central American Indians | 0.0 /100 | #326 | Tragic 18.0% |
| Yakama | 0.0 /100 | #327 | Tragic 18.0% |
| Blacks/African Americans | 0.0 /100 | #328 | Tragic 18.6% |
| Kiowa | 0.0 /100 | #329 | Tragic 18.6% |
| Dominicans | 0.0 /100 | #330 | Tragic 19.1% |
| Natives/Alaskans | 0.0 /100 | #331 | Tragic 19.2% |
| Apache | 0.0 /100 | #332 | Tragic 19.2% |
| Immigrants | Dominican Republic | 0.0 /100 | #333 | Tragic 19.3% |
| Houma | 0.0 /100 | #334 | Tragic 20.0% |
| Cheyenne | 0.0 /100 | #335 | Tragic 20.2% |
| Pueblo | 0.0 /100 | #336 | Tragic 20.7% |
Demographics Similar to Immigrants from Armenia by Female Poverty
In terms of female poverty, the demographic groups most similar to Immigrants from Armenia are French American Indian (15.1%, a difference of 0.080%), Cree (15.1%, a difference of 0.26%), Immigrants from Middle Africa (15.2%, a difference of 0.52%), Sudanese (15.2%, a difference of 0.57%), and Immigrants from Sudan (15.2%, a difference of 0.82%).
| Demographics | Rating | Rank | Female Poverty |
| Nigerians | 1.7 /100 | #231 | Tragic 14.8% |
| Osage | 1.5 /100 | #232 | Tragic 14.8% |
| Immigrants | Saudi Arabia | 1.4 /100 | #233 | Tragic 14.8% |
| Fijians | 1.1 /100 | #234 | Tragic 14.9% |
| Immigrants | Laos | 0.9 /100 | #235 | Tragic 15.0% |
| Cree | 0.7 /100 | #236 | Tragic 15.1% |
| French American Indians | 0.6 /100 | #237 | Tragic 15.1% |
| Immigrants | Armenia | 0.6 /100 | #238 | Tragic 15.1% |
| Immigrants | Middle Africa | 0.5 /100 | #239 | Tragic 15.2% |
| Sudanese | 0.5 /100 | #240 | Tragic 15.2% |
| Immigrants | Sudan | 0.4 /100 | #241 | Tragic 15.2% |
| Nepalese | 0.4 /100 | #242 | Tragic 15.2% |
| Nicaraguans | 0.3 /100 | #243 | Tragic 15.3% |
| Ecuadorians | 0.3 /100 | #244 | Tragic 15.3% |
| Spanish American Indians | 0.3 /100 | #245 | Tragic 15.3% |