Tlingit-Haida vs Spaniard Unemployment Among Seniors over 75 years
COMPARE
Tlingit-Haida
Spaniard
Unemployment Among Seniors over 75 years
Unemployment Among Seniors over 75 years Comparison
Tlingit-Haida
Spaniards
20.7%
UNEMPLOYMENT AMONG SENIORS OVER 75 YEARS
0.0/ 100
METRIC RATING
346th/ 347
METRIC RANK
8.9%
UNEMPLOYMENT AMONG SENIORS OVER 75 YEARS
22.0/ 100
METRIC RATING
204th/ 347
METRIC RANK
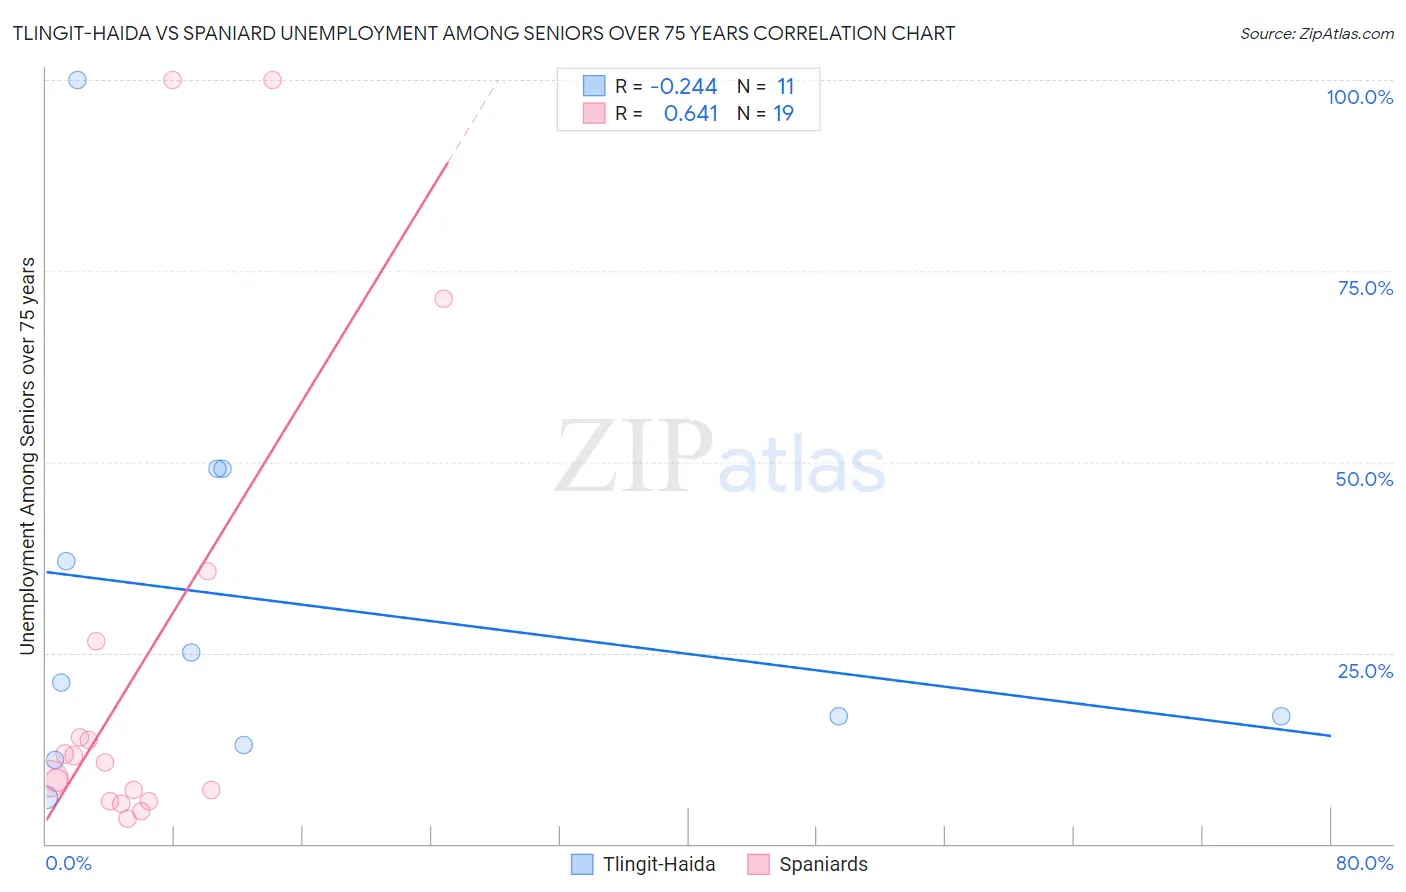
Tlingit-Haida vs Spaniard Unemployment Among Seniors over 75 years Correlation Chart
The statistical analysis conducted on geographies consisting of 44,675,055 people shows a weak negative correlation between the proportion of Tlingit-Haida and unemployment rate among seniors over the age of 75 in the United States with a correlation coefficient (R) of -0.244 and weighted average of 20.7%. Similarly, the statistical analysis conducted on geographies consisting of 214,427,527 people shows a significant positive correlation between the proportion of Spaniards and unemployment rate among seniors over the age of 75 in the United States with a correlation coefficient (R) of 0.641 and weighted average of 8.9%, a difference of 133.1%.
Unemployment Among Seniors over 75 years Correlation Summary
| Measurement | Tlingit-Haida | Spaniard |
| Minimum | 6.1% | 3.3% |
| Maximum | 100.0% | 100.0% |
| Range | 93.9% | 96.7% |
| Mean | 31.3% | 23.7% |
| Median | 21.1% | 10.6% |
| Interquartile 25% (IQ1) | 13.0% | 5.6% |
| Interquartile 75% (IQ3) | 49.1% | 26.5% |
| Interquartile Range (IQR) | 36.1% | 20.9% |
| Standard Deviation (Sample) | 27.1% | 31.2% |
| Standard Deviation (Population) | 25.8% | 30.4% |
Similar Demographics by Unemployment Among Seniors over 75 years
Demographics Similar to Tlingit-Haida by Unemployment Among Seniors over 75 years
In terms of unemployment among seniors over 75 years, the demographic groups most similar to Tlingit-Haida are Yakama (18.4%, a difference of 12.6%), Immigrants from Yemen (16.5%, a difference of 25.8%), Alaska Native (14.7%, a difference of 41.4%), Hmong (13.7%, a difference of 51.0%), and Lumbee (13.5%, a difference of 54.1%).
| Demographics | Rating | Rank | Unemployment Among Seniors over 75 years |
| Alaskan Athabascans | 0.0 /100 | #333 | Tragic 11.0% |
| Assyrians/Chaldeans/Syriacs | 0.0 /100 | #334 | Tragic 11.1% |
| French Canadians | 0.0 /100 | #335 | Tragic 11.2% |
| Immigrants | North Macedonia | 0.0 /100 | #336 | Tragic 11.3% |
| Cape Verdeans | 0.0 /100 | #337 | Tragic 11.4% |
| Immigrants | Cabo Verde | 0.0 /100 | #338 | Tragic 12.3% |
| Cajuns | 0.0 /100 | #339 | Tragic 12.5% |
| Yup'ik | 0.0 /100 | #340 | Tragic 12.8% |
| Lumbee | 0.0 /100 | #341 | Tragic 13.5% |
| Hmong | 0.0 /100 | #342 | Tragic 13.7% |
| Alaska Natives | 0.0 /100 | #343 | Tragic 14.7% |
| Immigrants | Yemen | 0.0 /100 | #344 | Tragic 16.5% |
| Yakama | 0.0 /100 | #345 | Tragic 18.4% |
| Tlingit-Haida | 0.0 /100 | #346 | Tragic 20.7% |
Demographics Similar to Spaniards by Unemployment Among Seniors over 75 years
In terms of unemployment among seniors over 75 years, the demographic groups most similar to Spaniards are Korean (8.9%, a difference of 0.010%), Immigrants from Northern Europe (8.9%, a difference of 0.14%), Russian (8.9%, a difference of 0.16%), Immigrants from Peru (8.9%, a difference of 0.17%), and Pakistani (8.9%, a difference of 0.25%).
| Demographics | Rating | Rank | Unemployment Among Seniors over 75 years |
| Immigrants | Laos | 26.3 /100 | #197 | Fair 8.9% |
| Eastern Europeans | 25.9 /100 | #198 | Fair 8.9% |
| Pakistanis | 25.4 /100 | #199 | Fair 8.9% |
| Osage | 25.4 /100 | #200 | Fair 8.9% |
| Immigrants | Peru | 24.3 /100 | #201 | Fair 8.9% |
| Russians | 24.1 /100 | #202 | Fair 8.9% |
| Immigrants | Northern Europe | 23.9 /100 | #203 | Fair 8.9% |
| Spaniards | 22.0 /100 | #204 | Fair 8.9% |
| Koreans | 21.9 /100 | #205 | Fair 8.9% |
| Immigrants | Western Europe | 18.2 /100 | #206 | Poor 8.9% |
| Malaysians | 16.3 /100 | #207 | Poor 8.9% |
| Immigrants | Philippines | 15.8 /100 | #208 | Poor 8.9% |
| Salvadorans | 15.4 /100 | #209 | Poor 8.9% |
| Bermudans | 15.0 /100 | #210 | Poor 8.9% |
| Delaware | 14.6 /100 | #211 | Poor 9.0% |