Tlingit-Haida vs South American Indian In Labor Force | Age 45-54

COMPARE

Tlingit-Haida
Race
Ancestry
AfghanAfricanAlaska NativeAlaskan AthabascanAlbanianAleutAlsatianAmericanApacheArabArapahoArgentineanArmenianAssyrian/Chaldean/SyriacAustralianAustrianBahamianBangladeshiBarbadianBasqueBelgianBelizeanBermudanBhutaneseBlackfeetBolivianBrazilianBritishBritish West IndianBulgarianBurmeseCajunCambodianCanadianCape VerdeanCarpatho RusynCelticCentral AmericanCentral American IndianCherokeeCheyenneChickasawChileanChineseChippewaChoctawColombianColvilleComancheCosta RicanCreeCreekCroatianCrowCubanCypriotCzechCzechoslovakianDanishDelawareDominicanDutchDutch West IndianEastern EuropeanEcuadorianEgyptianEnglishEstonianEthiopianEuropeanFijianFilipinoFinnishFrenchFrench American IndianFrench CanadianGermanGerman RussianGhanaianGreekGuamanian/ChamorroGuatemalanGuyaneseHaitianHmongHonduranHopiHoumaHungarianIcelanderIndian (Asian)IndonesianInupiatIranianIraqiIrishIroquoisIsraeliItalianJamaicanJapaneseJordanianKenyanKiowaKoreanLaotianLatvianLebaneseLiberianLithuanianLumbeeLuxembourgerMacedonianMalaysianMalteseMarshalleseMenomineeMexicanMexican American IndianMongolianMoroccanNative HawaiianNavajoNepaleseNew ZealanderNicaraguanNigerianNorthern EuropeanNorwegianOkinawanOsageOttawaPaiutePakistaniPalestinianPanamanianParaguayanPennsylvania GermanPeruvianPimaPolishPortuguesePotawatomiPuebloPuerto RicanPuget Sound SalishRomanianRussianSalvadoranSamoanScandinavianScotch-IrishScottishSeminoleSenegaleseSerbianShoshoneSierra LeoneanSiouxSlavicSlovakSloveneSomaliSouth AfricanSouth AmericanSoviet UnionSpaniardSpanishSpanish AmericanSpanish American IndianSri LankanSubsaharan AfricanSudaneseSwedishSwissSyrianTaiwaneseThaiTlingit-HaidaTohono O'OdhamTonganTrinidadian and TobagonianTsimshianTurkishU.S. Virgin IslanderUgandanUkrainianUruguayanUteVenezuelanVietnameseWelshWest IndianYakamaYaquiYugoslavianYumanYup'ikZimbabwean
Immigration
NonimmigrantsImmigrantsAfghanistanAfricaAlbaniaArgentinaArmeniaAsiaAustraliaAustriaBahamasBangladeshBarbadosBelarusBelgiumBelizeBoliviaBosnia and HerzegovinaBrazilBulgariaBurma/MyanmarCabo VerdeCambodiaCameroonCanadaCaribbeanCentral AmericaChileChinaColombiaCongoCosta RicaCroatiaCubaCzechoslovakiaDenmarkDominicaDominican RepublicEastern AfricaEastern AsiaEastern EuropeEcuadorEgyptEl SalvadorEnglandEritreaEthiopiaEuropeFijiFranceGermanyGhanaGreeceGrenadaGuatemalaGuyanaHaitiHondurasHong KongHungaryIndiaIndonesiaIranIraqIrelandIsraelItalyJamaicaJapanJordanKazakhstanKenyaKoreaKuwaitLaosLatin AmericaLatviaLebanonLiberiaLithuaniaMalaysiaMexicoMicronesiaMiddle AfricaMoldovaMoroccoNepalNetherlandsNicaraguaNigeriaNorth AmericaNorth MacedoniaNorthern AfricaNorthern EuropeNorwayOceaniaPakistanPanamaPeruPhilippinesPolandPortugalRomaniaRussiaSaudi ArabiaScotlandSenegalSerbiaSierra LeoneSingaporeSomaliaSouth AfricaSouth AmericaSouth Central AsiaSouth Eastern AsiaSouthern EuropeSpainSri LankaSt. Vincent and the GrenadinesSudanSwedenSwitzerlandSyriaTaiwanThailandTrinidad and TobagoTurkeyUgandaUkraineUruguayUzbekistanVenezuelaVietnamWest IndiesWestern AfricaWestern AsiaWestern EuropeYemenZaireZimbabweAzores
South American Indian
Race
Ancestry
AfghanAfricanAlaska NativeAlaskan AthabascanAlbanianAleutAlsatianAmericanApacheArabArapahoArgentineanArmenianAssyrian/Chaldean/SyriacAustralianAustrianBahamianBangladeshiBarbadianBasqueBelgianBelizeanBermudanBhutaneseBlackfeetBolivianBrazilianBritishBritish West IndianBulgarianBurmeseCajunCambodianCanadianCape VerdeanCarpatho RusynCelticCentral AmericanCentral American IndianCherokeeCheyenneChickasawChileanChineseChippewaChoctawColombianColvilleComancheCosta RicanCreeCreekCroatianCrowCubanCypriotCzechCzechoslovakianDanishDelawareDominicanDutchDutch West IndianEastern EuropeanEcuadorianEgyptianEnglishEstonianEthiopianEuropeanFijianFilipinoFinnishFrenchFrench American IndianFrench CanadianGermanGerman RussianGhanaianGreekGuamanian/ChamorroGuatemalanGuyaneseHaitianHmongHonduranHopiHoumaHungarianIcelanderIndian (Asian)IndonesianInupiatIranianIraqiIrishIroquoisIsraeliItalianJamaicanJapaneseJordanianKenyanKiowaKoreanLaotianLatvianLebaneseLiberianLithuanianLumbeeLuxembourgerMacedonianMalaysianMalteseMarshalleseMenomineeMexicanMexican American IndianMongolianMoroccanNative HawaiianNavajoNepaleseNew ZealanderNicaraguanNigerianNorthern EuropeanNorwegianOkinawanOsageOttawaPaiutePakistaniPalestinianPanamanianParaguayanPennsylvania GermanPeruvianPimaPolishPortuguesePotawatomiPuebloPuerto RicanPuget Sound SalishRomanianRussianSalvadoranSamoanScandinavianScotch-IrishScottishSeminoleSenegaleseSerbianShoshoneSierra LeoneanSiouxSlavicSlovakSloveneSomaliSouth AfricanSouth AmericanSouth American IndianSoviet UnionSpaniardSpanishSpanish AmericanSpanish American IndianSri LankanSubsaharan AfricanSudaneseSwedishSwissSyrianTaiwaneseThaiTohono O'OdhamTonganTrinidadian and TobagonianTsimshianTurkishU.S. Virgin IslanderUgandanUkrainianUruguayanUteVenezuelanVietnameseWelshWest IndianYakamaYaquiYugoslavianYumanYup'ikZimbabwean
Immigration
NonimmigrantsImmigrantsAfghanistanAfricaAlbaniaArgentinaArmeniaAsiaAustraliaAustriaBahamasBangladeshBarbadosBelarusBelgiumBelizeBoliviaBosnia and HerzegovinaBrazilBulgariaBurma/MyanmarCabo VerdeCambodiaCameroonCanadaCaribbeanCentral AmericaChileChinaColombiaCongoCosta RicaCroatiaCubaCzechoslovakiaDenmarkDominicaDominican RepublicEastern AfricaEastern AsiaEastern EuropeEcuadorEgyptEl SalvadorEnglandEritreaEthiopiaEuropeFijiFranceGermanyGhanaGreeceGrenadaGuatemalaGuyanaHaitiHondurasHong KongHungaryIndiaIndonesiaIranIraqIrelandIsraelItalyJamaicaJapanJordanKazakhstanKenyaKoreaKuwaitLaosLatin AmericaLatviaLebanonLiberiaLithuaniaMalaysiaMexicoMicronesiaMiddle AfricaMoldovaMoroccoNepalNetherlandsNicaraguaNigeriaNorth AmericaNorth MacedoniaNorthern AfricaNorthern EuropeNorwayOceaniaPakistanPanamaPeruPhilippinesPolandPortugalRomaniaRussiaSaudi ArabiaScotlandSenegalSerbiaSierra LeoneSingaporeSomaliaSouth AfricaSouth AmericaSouth Central AsiaSouth Eastern AsiaSouthern EuropeSpainSri LankaSt. Vincent and the GrenadinesSudanSwedenSwitzerlandSyriaTaiwanThailandTrinidad and TobagoTurkeyUgandaUkraineUruguayUzbekistanVenezuelaVietnamWest IndiesWestern AfricaWestern AsiaWestern EuropeYemenZaireZimbabweAzores
In Labor Force | Age 45-54
Income
Poverty
Unemployment
Labor Participation
Family Structure
Vehicle Availability
Education Level
Disability

In Labor Force | Age 45-54 Comparison

Tlingit-Haida

South American Indians

Exceptional
Good
83.9%
IN LABOR FORCE | AGE 45-54
99.8/ 100
METRIC RATING
23rd/ 347
METRIC RANK
82.9%
IN LABOR FORCE | AGE 45-54
62.2/ 100
METRIC RATING
161st/ 347
METRIC RANK

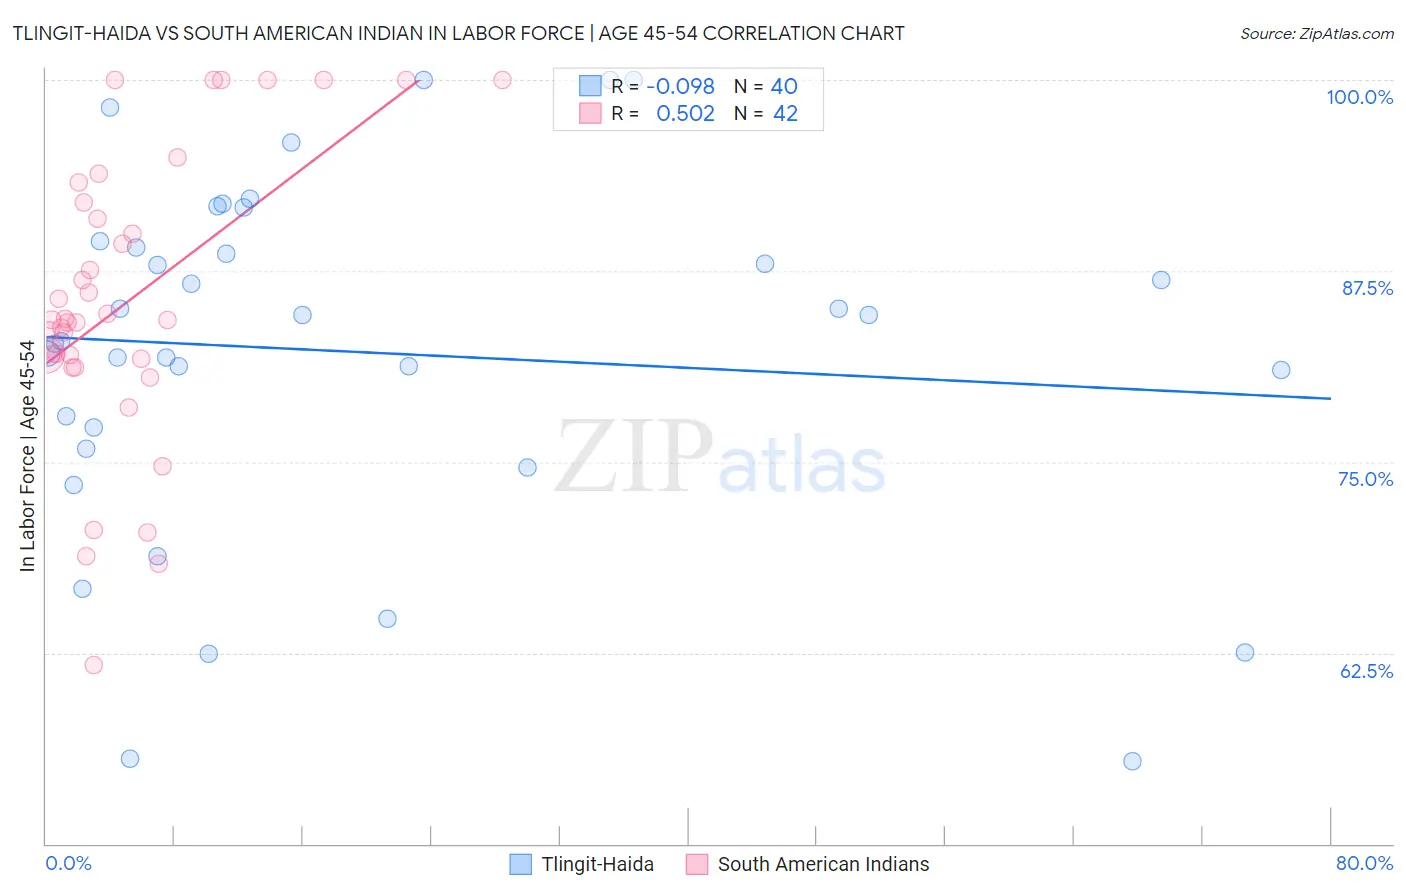
Tlingit-Haida vs South American Indian In Labor Force | Age 45-54 Correlation Chart

The statistical analysis conducted on geographies consisting of 60,861,176 people shows a slight negative correlation between the proportion of Tlingit-Haida and labor force participation rate among population between the ages 45 and 54 in the United States with a correlation coefficient (R) of -0.098 and weighted average of 83.9%. Similarly, the statistical analysis conducted on geographies consisting of 164,535,706 people shows a substantial positive correlation between the proportion of South American Indians and labor force participation rate among population between the ages 45 and 54 in the United States with a correlation coefficient (R) of 0.502 and weighted average of 82.9%, a difference of 1.3%.
Tlingit-Haida vs South American Indian In Labor Force | Age 45-54

In Labor Force | Age 45-54 Correlation Summary

MeasurementTlingit-HaidaSouth American Indian
Minimum55.4%61.7%
Maximum100.0%100.0%
Range44.6%38.3%
Mean82.2%85.5%
Median83.7%84.3%
Interquartile 25% (IQ1)76.5%81.7%
Interquartile 75% (IQ3)89.2%91.9%
Interquartile Range (IQR)12.7%10.2%
Standard Deviation (Sample)11.5%9.5%
Standard Deviation (Population)11.4%9.4%

Similar Demographics by In Labor Force | Age 45-54

Demographics Similar to Tlingit-Haida by In Labor Force | Age 45-54

In terms of in labor force | age 45-54, the demographic groups most similar to Tlingit-Haida are Immigrants from Ireland (83.9%, a difference of 0.0%), Immigrants from Eastern Africa (83.9%, a difference of 0.010%), Immigrants from Sri Lanka (83.9%, a difference of 0.010%), Slovene (83.9%, a difference of 0.010%), and Czech (83.9%, a difference of 0.020%).
DemographicsRating | RankIn Labor Force | Age 45-54
Immigrants | Nepal
99.9
/100
|
#16
Exceptional
84.0%
Zimbabweans
99.9
/100
|
#17
Exceptional
84.0%
Immigrants | South Central Asia
99.9
/100
|
#18
Exceptional
84.0%
Czechs
99.8
/100
|
#19
Exceptional
83.9%
Immigrants | Eastern Africa
99.8
/100
|
#20
Exceptional
83.9%
Immigrants | Sri Lanka
99.8
/100
|
#21
Exceptional
83.9%
Immigrants | Ireland
99.8
/100
|
#22
Exceptional
83.9%
Tlingit-Haida
99.8
/100
|
#23
Exceptional
83.9%
Slovenes
99.8
/100
|
#24
Exceptional
83.9%
Immigrants | North Macedonia
99.8
/100
|
#25
Exceptional
83.9%
Immigrants | Serbia
99.8
/100
|
#26
Exceptional
83.9%
Immigrants | Brazil
99.8
/100
|
#27
Exceptional
83.9%
Immigrants | Lithuania
99.8
/100
|
#28
Exceptional
83.9%
Immigrants | Pakistan
99.7
/100
|
#29
Exceptional
83.8%
Immigrants | Bulgaria
99.7
/100
|
#30
Exceptional
83.8%

Demographics Similar to South American Indians by In Labor Force | Age 45-54

In terms of in labor force | age 45-54, the demographic groups most similar to South American Indians are Haitian (82.8%, a difference of 0.0%), Dutch (82.8%, a difference of 0.0%), Laotian (82.9%, a difference of 0.010%), German Russian (82.8%, a difference of 0.010%), and Immigrants from Austria (82.9%, a difference of 0.020%).
DemographicsRating | RankIn Labor Force | Age 45-54
Immigrants | Ghana
70.3
/100
|
#154
Good
82.9%
Immigrants | Philippines
69.0
/100
|
#155
Good
82.9%
Immigrants | Saudi Arabia
68.8
/100
|
#156
Good
82.9%
Immigrants | Australia
68.2
/100
|
#157
Good
82.9%
Immigrants | Southern Europe
67.8
/100
|
#158
Good
82.9%
Immigrants | Austria
64.6
/100
|
#159
Good
82.9%
Laotians
62.8
/100
|
#160
Good
82.9%
South American Indians
62.2
/100
|
#161
Good
82.9%
Haitians
61.8
/100
|
#162
Good
82.8%
Dutch
61.7
/100
|
#163
Good
82.8%
German Russians
61.3
/100
|
#164
Good
82.8%
Immigrants | Sudan
59.9
/100
|
#165
Average
82.8%
Immigrants | South Eastern Asia
57.4
/100
|
#166
Average
82.8%
Swiss
56.5
/100
|
#167
Average
82.8%
Immigrants | South Africa
55.8
/100
|
#168
Average
82.8%