Spanish American Indian vs South American Indian Family Poverty
COMPARE
Spanish American Indian
South American Indian
Family Poverty
Family Poverty Comparison
Spanish American Indians
South American Indians
10.9%
FAMILY POVERTY
0.2/ 100
METRIC RATING
262nd/ 347
METRIC RANK
9.1%
FAMILY POVERTY
38.7/ 100
METRIC RATING
184th/ 347
METRIC RANK
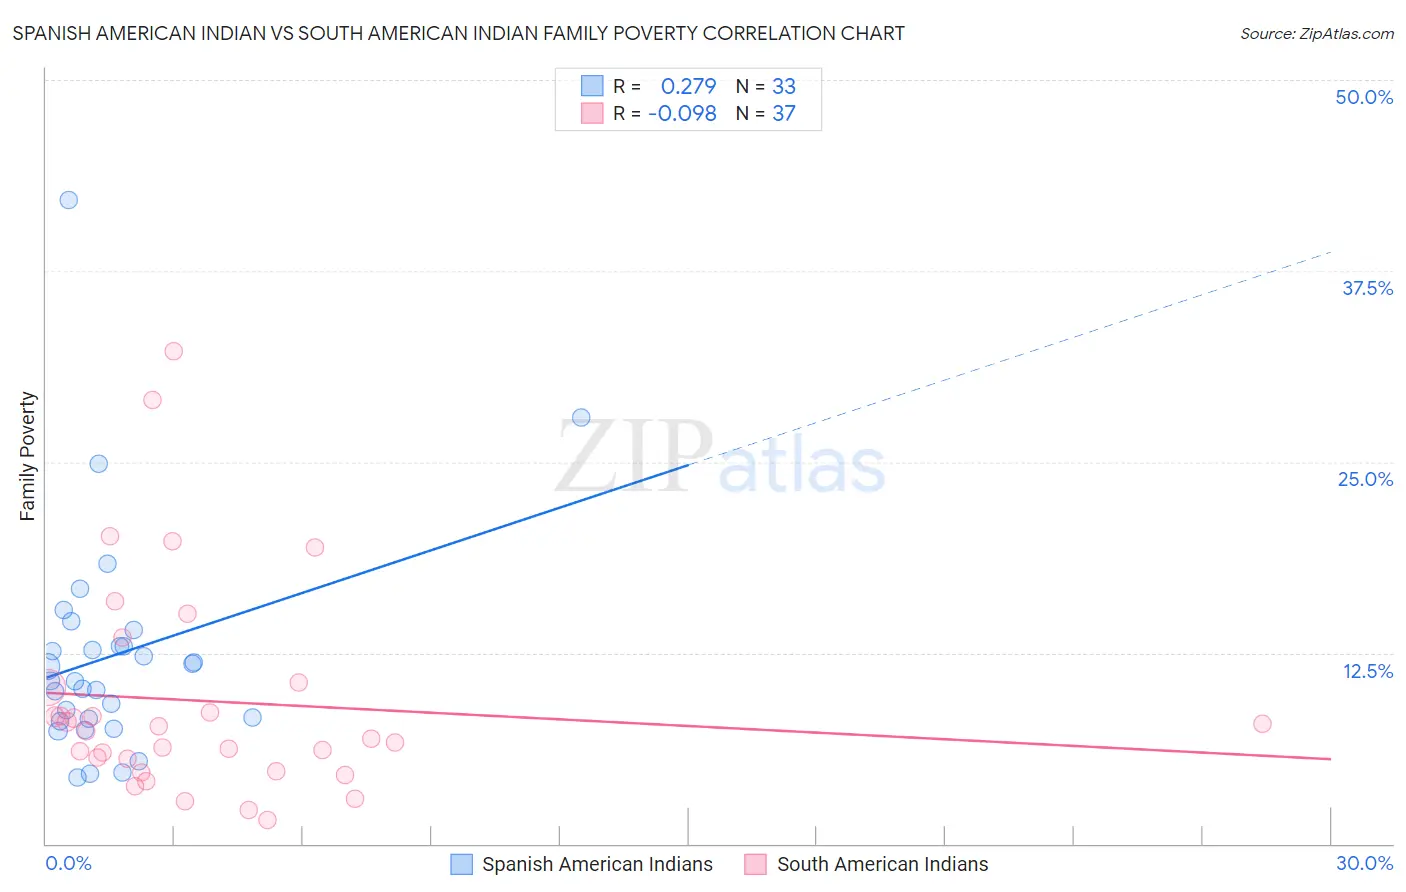
Spanish American Indian vs South American Indian Family Poverty Correlation Chart
The statistical analysis conducted on geographies consisting of 73,121,787 people shows a weak positive correlation between the proportion of Spanish American Indians and poverty level among families in the United States with a correlation coefficient (R) of 0.279 and weighted average of 10.9%. Similarly, the statistical analysis conducted on geographies consisting of 164,455,459 people shows a slight negative correlation between the proportion of South American Indians and poverty level among families in the United States with a correlation coefficient (R) of -0.098 and weighted average of 9.1%, a difference of 19.4%.
Family Poverty Correlation Summary
| Measurement | Spanish American Indian | South American Indian |
| Minimum | 4.4% | 1.6% |
| Maximum | 42.1% | 32.2% |
| Range | 37.8% | 30.7% |
| Mean | 12.4% | 9.3% |
| Median | 10.7% | 7.4% |
| Interquartile 25% (IQ1) | 8.1% | 5.1% |
| Interquartile 75% (IQ3) | 13.5% | 10.4% |
| Interquartile Range (IQR) | 5.4% | 5.2% |
| Standard Deviation (Sample) | 7.4% | 7.0% |
| Standard Deviation (Population) | 7.3% | 6.9% |
Similar Demographics by Family Poverty
Demographics Similar to Spanish American Indians by Family Poverty
In terms of family poverty, the demographic groups most similar to Spanish American Indians are Shoshone (10.9%, a difference of 0.13%), Bangladeshi (10.9%, a difference of 0.17%), Cape Verdean (10.9%, a difference of 0.26%), Trinidadian and Tobagonian (10.9%, a difference of 0.28%), and Immigrants from Trinidad and Tobago (10.9%, a difference of 0.33%).
| Demographics | Rating | Rank | Family Poverty |
| Immigrants | Liberia | 0.2 /100 | #255 | Tragic 10.8% |
| Chickasaw | 0.2 /100 | #256 | Tragic 10.8% |
| Immigrants | Ghana | 0.2 /100 | #257 | Tragic 10.8% |
| Sub-Saharan Africans | 0.2 /100 | #258 | Tragic 10.9% |
| Mexican American Indians | 0.2 /100 | #259 | Tragic 10.9% |
| Bangladeshis | 0.2 /100 | #260 | Tragic 10.9% |
| Shoshone | 0.2 /100 | #261 | Tragic 10.9% |
| Spanish American Indians | 0.2 /100 | #262 | Tragic 10.9% |
| Cape Verdeans | 0.1 /100 | #263 | Tragic 10.9% |
| Trinidadians and Tobagonians | 0.1 /100 | #264 | Tragic 10.9% |
| Immigrants | Trinidad and Tobago | 0.1 /100 | #265 | Tragic 10.9% |
| Immigrants | El Salvador | 0.1 /100 | #266 | Tragic 11.0% |
| Comanche | 0.1 /100 | #267 | Tragic 11.0% |
| Jamaicans | 0.1 /100 | #268 | Tragic 11.1% |
| Immigrants | Ecuador | 0.1 /100 | #269 | Tragic 11.1% |
Demographics Similar to South American Indians by Family Poverty
In terms of family poverty, the demographic groups most similar to South American Indians are Immigrants from Saudi Arabia (9.1%, a difference of 0.010%), Uruguayan (9.1%, a difference of 0.070%), Immigrants from Morocco (9.1%, a difference of 0.20%), Hmong (9.1%, a difference of 0.21%), and Colombian (9.2%, a difference of 0.36%).
| Demographics | Rating | Rank | Family Poverty |
| Hawaiians | 47.2 /100 | #177 | Average 9.0% |
| Immigrants | Cameroon | 47.1 /100 | #178 | Average 9.0% |
| Immigrants | Iraq | 44.4 /100 | #179 | Average 9.1% |
| Immigrants | Uganda | 43.4 /100 | #180 | Average 9.1% |
| Hmong | 40.2 /100 | #181 | Average 9.1% |
| Immigrants | Morocco | 40.2 /100 | #182 | Average 9.1% |
| Uruguayans | 39.2 /100 | #183 | Fair 9.1% |
| South American Indians | 38.7 /100 | #184 | Fair 9.1% |
| Immigrants | Saudi Arabia | 38.6 /100 | #185 | Fair 9.1% |
| Colombians | 36.1 /100 | #186 | Fair 9.2% |
| Delaware | 35.4 /100 | #187 | Fair 9.2% |
| Immigrants | Kenya | 34.0 /100 | #188 | Fair 9.2% |
| Immigrants | Afghanistan | 32.1 /100 | #189 | Fair 9.2% |
| Arabs | 31.5 /100 | #190 | Fair 9.2% |
| Ugandans | 28.7 /100 | #191 | Fair 9.3% |