Immigrants from Iran vs South American Indian Family Poverty
COMPARE
Immigrants from Iran
South American Indian
Family Poverty
Family Poverty Comparison
Immigrants from Iran
South American Indians
7.3%
FAMILY POVERTY
99.7/ 100
METRIC RATING
21st/ 347
METRIC RANK
9.1%
FAMILY POVERTY
38.7/ 100
METRIC RATING
184th/ 347
METRIC RANK
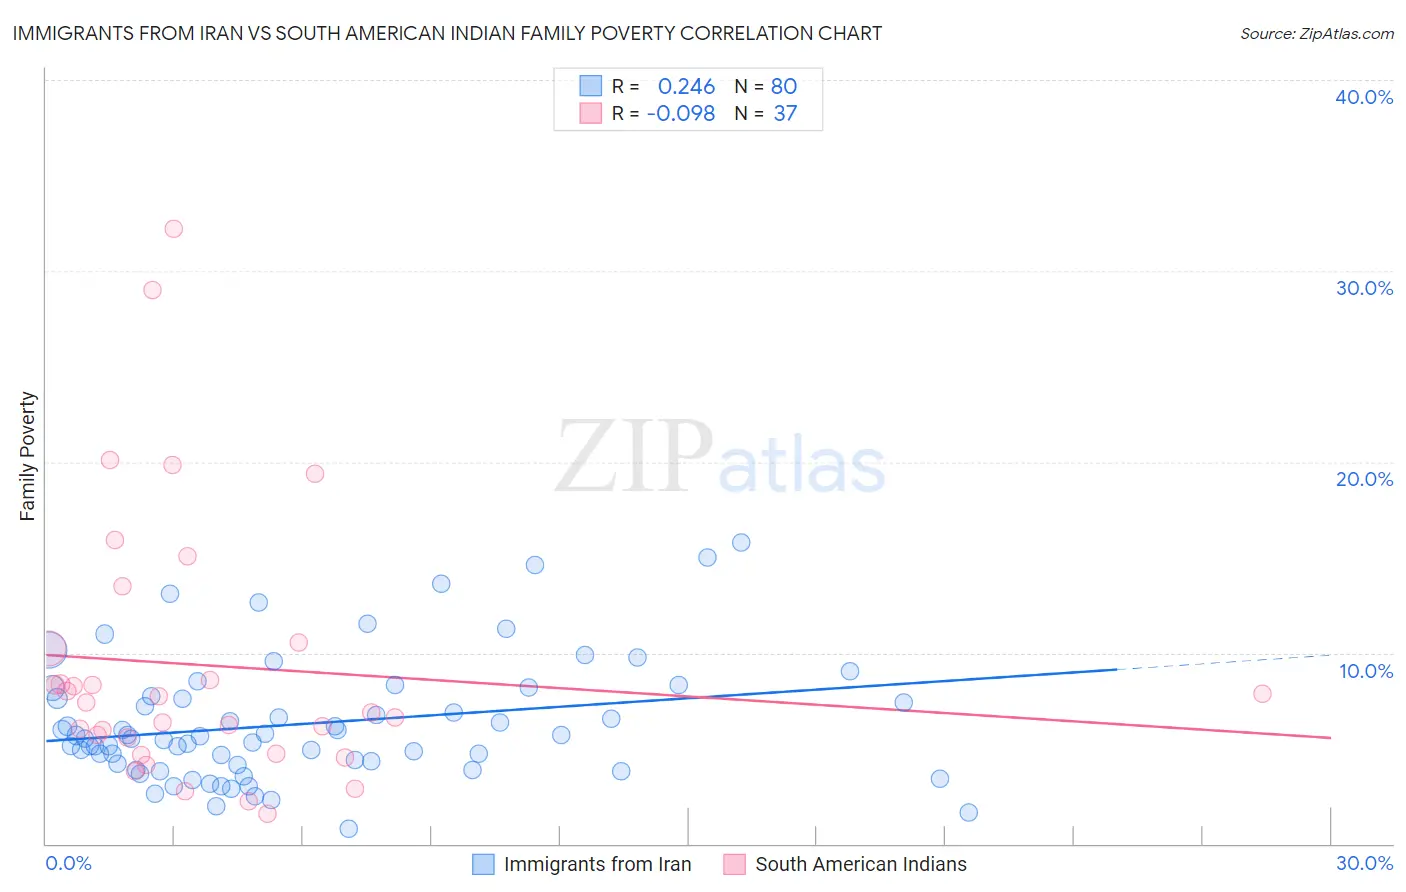
Immigrants from Iran vs South American Indian Family Poverty Correlation Chart
The statistical analysis conducted on geographies consisting of 279,394,600 people shows a weak positive correlation between the proportion of Immigrants from Iran and poverty level among families in the United States with a correlation coefficient (R) of 0.246 and weighted average of 7.3%. Similarly, the statistical analysis conducted on geographies consisting of 164,455,459 people shows a slight negative correlation between the proportion of South American Indians and poverty level among families in the United States with a correlation coefficient (R) of -0.098 and weighted average of 9.1%, a difference of 25.8%.
Family Poverty Correlation Summary
| Measurement | Immigrants from Iran | South American Indian |
| Minimum | 0.76% | 1.6% |
| Maximum | 15.8% | 32.2% |
| Range | 15.0% | 30.7% |
| Mean | 6.3% | 9.3% |
| Median | 5.6% | 7.4% |
| Interquartile 25% (IQ1) | 4.2% | 5.1% |
| Interquartile 75% (IQ3) | 7.7% | 10.4% |
| Interquartile Range (IQR) | 3.5% | 5.2% |
| Standard Deviation (Sample) | 3.2% | 7.0% |
| Standard Deviation (Population) | 3.2% | 6.9% |
Similar Demographics by Family Poverty
Demographics Similar to Immigrants from Iran by Family Poverty
In terms of family poverty, the demographic groups most similar to Immigrants from Iran are Immigrants from Hong Kong (7.3%, a difference of 0.20%), Eastern European (7.2%, a difference of 0.36%), Danish (7.3%, a difference of 0.44%), Assyrian/Chaldean/Syriac (7.3%, a difference of 0.45%), and Immigrants from Lithuania (7.2%, a difference of 0.67%).
| Demographics | Rating | Rank | Family Poverty |
| Iranians | 99.8 /100 | #14 | Exceptional 7.1% |
| Lithuanians | 99.8 /100 | #15 | Exceptional 7.2% |
| Immigrants | South Central Asia | 99.8 /100 | #16 | Exceptional 7.2% |
| Luxembourgers | 99.8 /100 | #17 | Exceptional 7.2% |
| Immigrants | Lithuania | 99.8 /100 | #18 | Exceptional 7.2% |
| Eastern Europeans | 99.7 /100 | #19 | Exceptional 7.2% |
| Immigrants | Hong Kong | 99.7 /100 | #20 | Exceptional 7.3% |
| Immigrants | Iran | 99.7 /100 | #21 | Exceptional 7.3% |
| Danes | 99.7 /100 | #22 | Exceptional 7.3% |
| Assyrians/Chaldeans/Syriacs | 99.7 /100 | #23 | Exceptional 7.3% |
| Croatians | 99.7 /100 | #24 | Exceptional 7.3% |
| Burmese | 99.7 /100 | #25 | Exceptional 7.3% |
| Cypriots | 99.6 /100 | #26 | Exceptional 7.3% |
| Immigrants | Scotland | 99.6 /100 | #27 | Exceptional 7.3% |
| Immigrants | Korea | 99.6 /100 | #28 | Exceptional 7.4% |
Demographics Similar to South American Indians by Family Poverty
In terms of family poverty, the demographic groups most similar to South American Indians are Immigrants from Saudi Arabia (9.1%, a difference of 0.010%), Uruguayan (9.1%, a difference of 0.070%), Immigrants from Morocco (9.1%, a difference of 0.20%), Hmong (9.1%, a difference of 0.21%), and Colombian (9.2%, a difference of 0.36%).
| Demographics | Rating | Rank | Family Poverty |
| Hawaiians | 47.2 /100 | #177 | Average 9.0% |
| Immigrants | Cameroon | 47.1 /100 | #178 | Average 9.0% |
| Immigrants | Iraq | 44.4 /100 | #179 | Average 9.1% |
| Immigrants | Uganda | 43.4 /100 | #180 | Average 9.1% |
| Hmong | 40.2 /100 | #181 | Average 9.1% |
| Immigrants | Morocco | 40.2 /100 | #182 | Average 9.1% |
| Uruguayans | 39.2 /100 | #183 | Fair 9.1% |
| South American Indians | 38.7 /100 | #184 | Fair 9.1% |
| Immigrants | Saudi Arabia | 38.6 /100 | #185 | Fair 9.1% |
| Colombians | 36.1 /100 | #186 | Fair 9.2% |
| Delaware | 35.4 /100 | #187 | Fair 9.2% |
| Immigrants | Kenya | 34.0 /100 | #188 | Fair 9.2% |
| Immigrants | Afghanistan | 32.1 /100 | #189 | Fair 9.2% |
| Arabs | 31.5 /100 | #190 | Fair 9.2% |
| Ugandans | 28.7 /100 | #191 | Fair 9.3% |