Immigrants from Oceania vs Salvadoran Child Poverty Among Girls Under 16
COMPARE
Immigrants from Oceania
Salvadoran
Child Poverty Among Girls Under 16
Child Poverty Among Girls Under 16 Comparison
Immigrants from Oceania
Salvadorans
16.1%
CHILD POVERTY AMONG GIRLS UNDER 16
68.4/ 100
METRIC RATING
163rd/ 347
METRIC RANK
19.4%
CHILD POVERTY AMONG GIRLS UNDER 16
0.2/ 100
METRIC RATING
258th/ 347
METRIC RANK
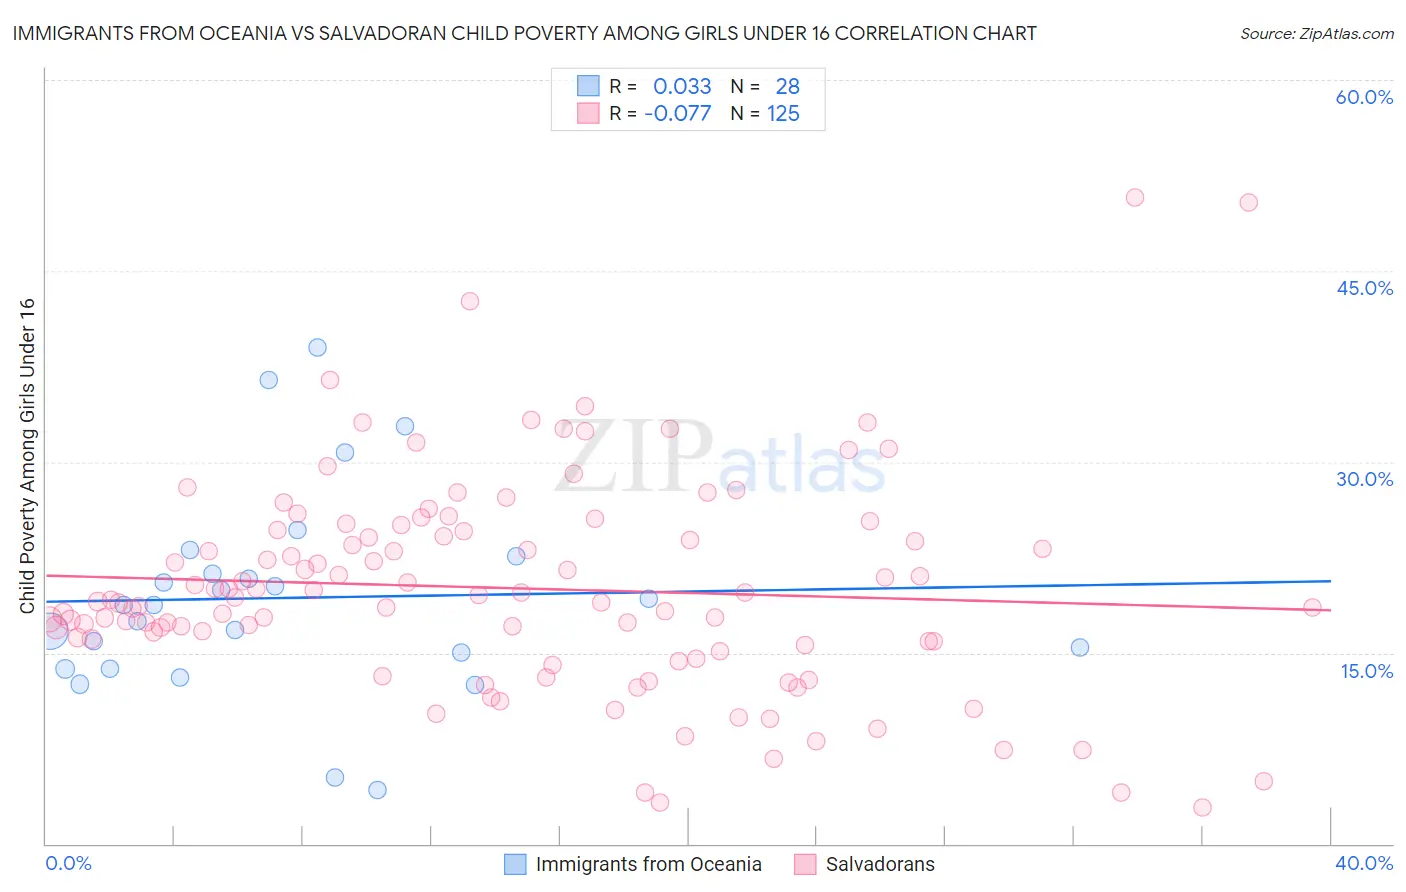
Immigrants from Oceania vs Salvadoran Child Poverty Among Girls Under 16 Correlation Chart
The statistical analysis conducted on geographies consisting of 301,068,502 people shows no correlation between the proportion of Immigrants from Oceania and poverty level among girls under the age of 16 in the United States with a correlation coefficient (R) of 0.033 and weighted average of 16.1%. Similarly, the statistical analysis conducted on geographies consisting of 393,655,478 people shows a slight negative correlation between the proportion of Salvadorans and poverty level among girls under the age of 16 in the United States with a correlation coefficient (R) of -0.077 and weighted average of 19.4%, a difference of 20.3%.
Child Poverty Among Girls Under 16 Correlation Summary
| Measurement | Immigrants from Oceania | Salvadoran |
| Minimum | 4.3% | 2.8% |
| Maximum | 39.0% | 50.8% |
| Range | 34.8% | 48.0% |
| Mean | 19.3% | 20.1% |
| Median | 18.7% | 19.2% |
| Interquartile 25% (IQ1) | 14.4% | 15.8% |
| Interquartile 75% (IQ3) | 21.9% | 24.6% |
| Interquartile Range (IQR) | 7.5% | 8.8% |
| Standard Deviation (Sample) | 8.0% | 8.4% |
| Standard Deviation (Population) | 7.9% | 8.4% |
Similar Demographics by Child Poverty Among Girls Under 16
Demographics Similar to Immigrants from Oceania by Child Poverty Among Girls Under 16
In terms of child poverty among girls under 16, the demographic groups most similar to Immigrants from Oceania are French Canadian (16.1%, a difference of 0.050%), Immigrants from Colombia (16.1%, a difference of 0.070%), Immigrants from Germany (16.1%, a difference of 0.14%), South American (16.1%, a difference of 0.16%), and Uruguayan (16.2%, a difference of 0.48%).
| Demographics | Rating | Rank | Child Poverty Among Girls Under 16 |
| Immigrants | Fiji | 76.1 /100 | #156 | Good 15.9% |
| Colombians | 76.1 /100 | #157 | Good 15.9% |
| Guamanians/Chamorros | 75.3 /100 | #158 | Good 15.9% |
| Slovaks | 75.2 /100 | #159 | Good 15.9% |
| French | 72.8 /100 | #160 | Good 16.0% |
| Immigrants | Northern Africa | 72.0 /100 | #161 | Good 16.0% |
| French Canadians | 68.7 /100 | #162 | Good 16.1% |
| Immigrants | Oceania | 68.4 /100 | #163 | Good 16.1% |
| Immigrants | Colombia | 67.8 /100 | #164 | Good 16.1% |
| Immigrants | Germany | 67.3 /100 | #165 | Good 16.1% |
| South Americans | 67.2 /100 | #166 | Good 16.1% |
| Uruguayans | 64.7 /100 | #167 | Good 16.2% |
| Yugoslavians | 64.4 /100 | #168 | Good 16.2% |
| Costa Ricans | 64.2 /100 | #169 | Good 16.2% |
| Immigrants | Venezuela | 64.2 /100 | #170 | Good 16.2% |
Demographics Similar to Salvadorans by Child Poverty Among Girls Under 16
In terms of child poverty among girls under 16, the demographic groups most similar to Salvadorans are Ottawa (19.4%, a difference of 0.10%), Guyanese (19.4%, a difference of 0.13%), Trinidadian and Tobagonian (19.3%, a difference of 0.37%), Immigrants from Ecuador (19.3%, a difference of 0.44%), and Immigrants from Western Africa (19.3%, a difference of 0.46%).
| Demographics | Rating | Rank | Child Poverty Among Girls Under 16 |
| Immigrants | Trinidad and Tobago | 0.3 /100 | #251 | Tragic 19.2% |
| Immigrants | Middle Africa | 0.3 /100 | #252 | Tragic 19.2% |
| Immigrants | Guyana | 0.3 /100 | #253 | Tragic 19.3% |
| Immigrants | Western Africa | 0.3 /100 | #254 | Tragic 19.3% |
| Immigrants | Ecuador | 0.3 /100 | #255 | Tragic 19.3% |
| Trinidadians and Tobagonians | 0.2 /100 | #256 | Tragic 19.3% |
| Guyanese | 0.2 /100 | #257 | Tragic 19.4% |
| Salvadorans | 0.2 /100 | #258 | Tragic 19.4% |
| Ottawa | 0.2 /100 | #259 | Tragic 19.4% |
| Mexican American Indians | 0.2 /100 | #260 | Tragic 19.5% |
| Vietnamese | 0.2 /100 | #261 | Tragic 19.5% |
| Chickasaw | 0.1 /100 | #262 | Tragic 19.6% |
| Immigrants | Burma/Myanmar | 0.1 /100 | #263 | Tragic 19.7% |
| Jamaicans | 0.1 /100 | #264 | Tragic 19.7% |
| Immigrants | Jamaica | 0.1 /100 | #265 | Tragic 19.8% |