Costa Rican vs Jamaican Single Mother Poverty
COMPARE
Costa Rican
Jamaican
Single Mother Poverty
Single Mother Poverty Comparison
Costa Ricans
Jamaicans
29.0%
SINGLE MOTHER POVERTY
58.4/ 100
METRIC RATING
167th/ 347
METRIC RANK
29.9%
SINGLE MOTHER POVERTY
11.7/ 100
METRIC RATING
215th/ 347
METRIC RANK
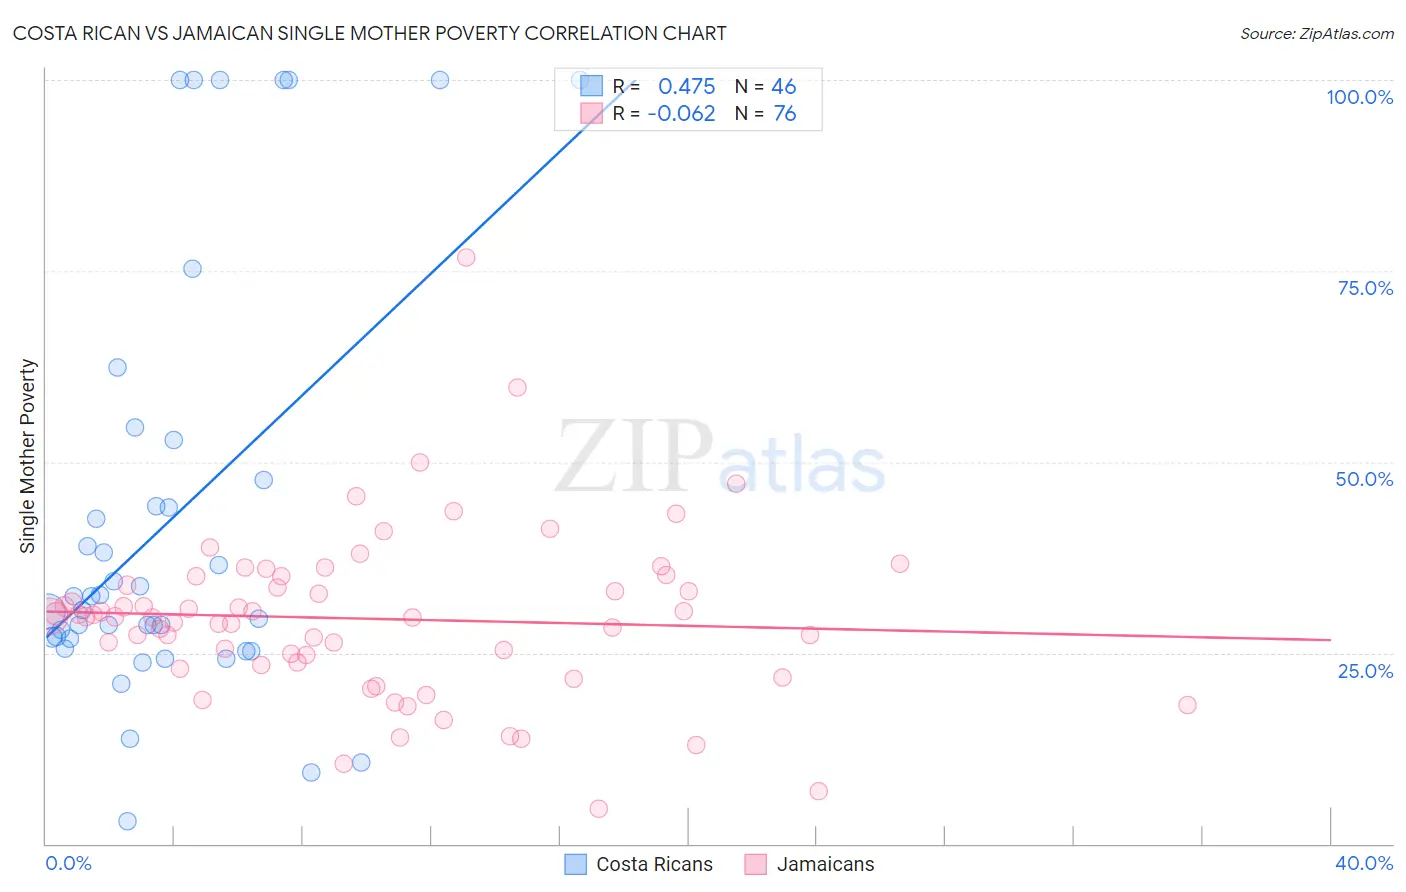
Costa Rican vs Jamaican Single Mother Poverty Correlation Chart
The statistical analysis conducted on geographies consisting of 249,968,027 people shows a moderate positive correlation between the proportion of Costa Ricans and poverty level among single mothers in the United States with a correlation coefficient (R) of 0.475 and weighted average of 29.0%. Similarly, the statistical analysis conducted on geographies consisting of 360,593,795 people shows a slight negative correlation between the proportion of Jamaicans and poverty level among single mothers in the United States with a correlation coefficient (R) of -0.062 and weighted average of 29.9%, a difference of 2.8%.
Single Mother Poverty Correlation Summary
| Measurement | Costa Rican | Jamaican |
| Minimum | 3.0% | 4.6% |
| Maximum | 100.0% | 76.7% |
| Range | 97.0% | 72.1% |
| Mean | 42.4% | 29.5% |
| Median | 31.5% | 29.7% |
| Interquartile 25% (IQ1) | 26.9% | 23.5% |
| Interquartile 75% (IQ3) | 47.6% | 34.4% |
| Interquartile Range (IQR) | 20.7% | 10.9% |
| Standard Deviation (Sample) | 27.7% | 11.0% |
| Standard Deviation (Population) | 27.4% | 11.0% |
Similar Demographics by Single Mother Poverty
Demographics Similar to Costa Ricans by Single Mother Poverty
In terms of single mother poverty, the demographic groups most similar to Costa Ricans are European (29.1%, a difference of 0.040%), Immigrants from Uruguay (29.1%, a difference of 0.060%), Inupiat (29.0%, a difference of 0.10%), Arab (29.0%, a difference of 0.12%), and New Zealander (29.1%, a difference of 0.16%).
| Demographics | Rating | Rank | Single Mother Poverty |
| Japanese | 68.0 /100 | #160 | Good 28.9% |
| Immigrants | Cambodia | 66.6 /100 | #161 | Good 28.9% |
| Scandinavians | 66.2 /100 | #162 | Good 28.9% |
| Immigrants | Nigeria | 65.9 /100 | #163 | Good 28.9% |
| Immigrants | Kenya | 65.9 /100 | #164 | Good 28.9% |
| Arabs | 60.7 /100 | #165 | Good 29.0% |
| Inupiat | 60.4 /100 | #166 | Good 29.0% |
| Costa Ricans | 58.4 /100 | #167 | Average 29.0% |
| Europeans | 57.6 /100 | #168 | Average 29.1% |
| Immigrants | Uruguay | 57.2 /100 | #169 | Average 29.1% |
| New Zealanders | 55.1 /100 | #170 | Average 29.1% |
| Puget Sound Salish | 55.1 /100 | #171 | Average 29.1% |
| Carpatho Rusyns | 53.8 /100 | #172 | Average 29.1% |
| British | 50.6 /100 | #173 | Average 29.2% |
| Immigrants | Saudi Arabia | 50.0 /100 | #174 | Average 29.2% |
Demographics Similar to Jamaicans by Single Mother Poverty
In terms of single mother poverty, the demographic groups most similar to Jamaicans are Liberian (29.9%, a difference of 0.0%), Immigrants from Western Africa (29.9%, a difference of 0.020%), Immigrants from Thailand (29.9%, a difference of 0.030%), Immigrants from Ghana (29.9%, a difference of 0.040%), and Nicaraguan (29.8%, a difference of 0.080%).
| Demographics | Rating | Rank | Single Mother Poverty |
| Immigrants | Guyana | 14.7 /100 | #208 | Poor 29.8% |
| Irish | 13.9 /100 | #209 | Poor 29.8% |
| Haitians | 13.3 /100 | #210 | Poor 29.8% |
| Guyanese | 12.8 /100 | #211 | Poor 29.8% |
| Nicaraguans | 12.4 /100 | #212 | Poor 29.8% |
| Immigrants | Thailand | 12.0 /100 | #213 | Poor 29.9% |
| Liberians | 11.7 /100 | #214 | Poor 29.9% |
| Jamaicans | 11.7 /100 | #215 | Poor 29.9% |
| Immigrants | Western Africa | 11.5 /100 | #216 | Poor 29.9% |
| Immigrants | Ghana | 11.3 /100 | #217 | Poor 29.9% |
| Hungarians | 10.3 /100 | #218 | Poor 29.9% |
| Finns | 9.3 /100 | #219 | Tragic 30.0% |
| Germans | 8.8 /100 | #220 | Tragic 30.0% |
| Immigrants | Eritrea | 7.7 /100 | #221 | Tragic 30.0% |
| Sudanese | 7.6 /100 | #222 | Tragic 30.0% |