Immigrants from Colombia vs Jamaican Single Mother Poverty
COMPARE
Immigrants from Colombia
Jamaican
Single Mother Poverty
Single Mother Poverty Comparison
Immigrants from Colombia
Jamaicans
28.5%
SINGLE MOTHER POVERTY
88.0/ 100
METRIC RATING
140th/ 347
METRIC RANK
29.9%
SINGLE MOTHER POVERTY
11.7/ 100
METRIC RATING
215th/ 347
METRIC RANK
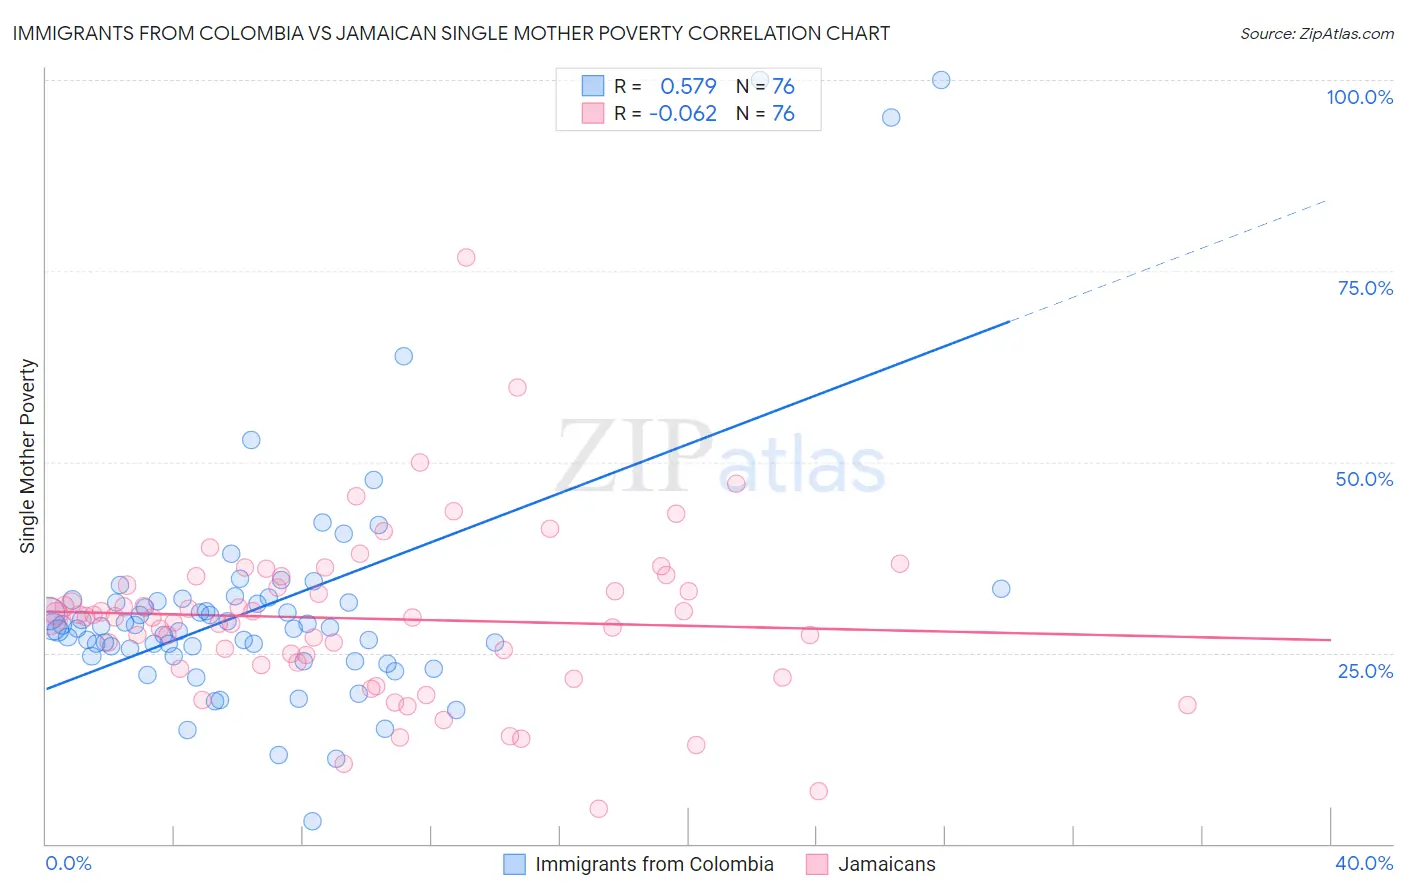
Immigrants from Colombia vs Jamaican Single Mother Poverty Correlation Chart
The statistical analysis conducted on geographies consisting of 370,210,316 people shows a substantial positive correlation between the proportion of Immigrants from Colombia and poverty level among single mothers in the United States with a correlation coefficient (R) of 0.579 and weighted average of 28.5%. Similarly, the statistical analysis conducted on geographies consisting of 360,593,795 people shows a slight negative correlation between the proportion of Jamaicans and poverty level among single mothers in the United States with a correlation coefficient (R) of -0.062 and weighted average of 29.9%, a difference of 4.9%.
Single Mother Poverty Correlation Summary
| Measurement | Immigrants from Colombia | Jamaican |
| Minimum | 2.9% | 4.6% |
| Maximum | 100.0% | 76.7% |
| Range | 97.1% | 72.1% |
| Mean | 31.0% | 29.5% |
| Median | 28.3% | 29.7% |
| Interquartile 25% (IQ1) | 25.1% | 23.5% |
| Interquartile 75% (IQ3) | 31.8% | 34.4% |
| Interquartile Range (IQR) | 6.7% | 10.9% |
| Standard Deviation (Sample) | 16.2% | 11.0% |
| Standard Deviation (Population) | 16.1% | 11.0% |
Similar Demographics by Single Mother Poverty
Demographics Similar to Immigrants from Colombia by Single Mother Poverty
In terms of single mother poverty, the demographic groups most similar to Immigrants from Colombia are Samoan (28.5%, a difference of 0.010%), Immigrants from Belgium (28.5%, a difference of 0.060%), Danish (28.5%, a difference of 0.10%), Native Hawaiian (28.4%, a difference of 0.11%), and Immigrants from Canada (28.4%, a difference of 0.11%).
| Demographics | Rating | Rank | Single Mother Poverty |
| Swedes | 89.4 /100 | #133 | Excellent 28.4% |
| Immigrants | Southern Europe | 89.2 /100 | #134 | Excellent 28.4% |
| Immigrants | Spain | 89.2 /100 | #135 | Excellent 28.4% |
| Native Hawaiians | 88.9 /100 | #136 | Excellent 28.4% |
| Immigrants | Canada | 88.9 /100 | #137 | Excellent 28.4% |
| Immigrants | Belgium | 88.5 /100 | #138 | Excellent 28.5% |
| Samoans | 88.1 /100 | #139 | Excellent 28.5% |
| Immigrants | Colombia | 88.0 /100 | #140 | Excellent 28.5% |
| Danes | 87.1 /100 | #141 | Excellent 28.5% |
| South Africans | 86.6 /100 | #142 | Excellent 28.5% |
| Immigrants | North America | 86.5 /100 | #143 | Excellent 28.5% |
| Luxembourgers | 86.4 /100 | #144 | Excellent 28.5% |
| Immigrants | South America | 86.1 /100 | #145 | Excellent 28.5% |
| Immigrants | Denmark | 86.1 /100 | #146 | Excellent 28.5% |
| Immigrants | Lebanon | 85.3 /100 | #147 | Excellent 28.6% |
Demographics Similar to Jamaicans by Single Mother Poverty
In terms of single mother poverty, the demographic groups most similar to Jamaicans are Liberian (29.9%, a difference of 0.0%), Immigrants from Western Africa (29.9%, a difference of 0.020%), Immigrants from Thailand (29.9%, a difference of 0.030%), Immigrants from Ghana (29.9%, a difference of 0.040%), and Nicaraguan (29.8%, a difference of 0.080%).
| Demographics | Rating | Rank | Single Mother Poverty |
| Immigrants | Guyana | 14.7 /100 | #208 | Poor 29.8% |
| Irish | 13.9 /100 | #209 | Poor 29.8% |
| Haitians | 13.3 /100 | #210 | Poor 29.8% |
| Guyanese | 12.8 /100 | #211 | Poor 29.8% |
| Nicaraguans | 12.4 /100 | #212 | Poor 29.8% |
| Immigrants | Thailand | 12.0 /100 | #213 | Poor 29.9% |
| Liberians | 11.7 /100 | #214 | Poor 29.9% |
| Jamaicans | 11.7 /100 | #215 | Poor 29.9% |
| Immigrants | Western Africa | 11.5 /100 | #216 | Poor 29.9% |
| Immigrants | Ghana | 11.3 /100 | #217 | Poor 29.9% |
| Hungarians | 10.3 /100 | #218 | Poor 29.9% |
| Finns | 9.3 /100 | #219 | Tragic 30.0% |
| Germans | 8.8 /100 | #220 | Tragic 30.0% |
| Immigrants | Eritrea | 7.7 /100 | #221 | Tragic 30.0% |
| Sudanese | 7.6 /100 | #222 | Tragic 30.0% |