Samoan vs Immigrants from Albania Single Father Poverty
COMPARE
Samoan
Immigrants from Albania
Single Father Poverty
Single Father Poverty Comparison
Samoans
Immigrants from Albania
13.8%
SINGLE FATHER POVERTY
100.0/ 100
METRIC RATING
8th/ 347
METRIC RANK
17.2%
SINGLE FATHER POVERTY
0.7/ 100
METRIC RATING
257th/ 347
METRIC RANK
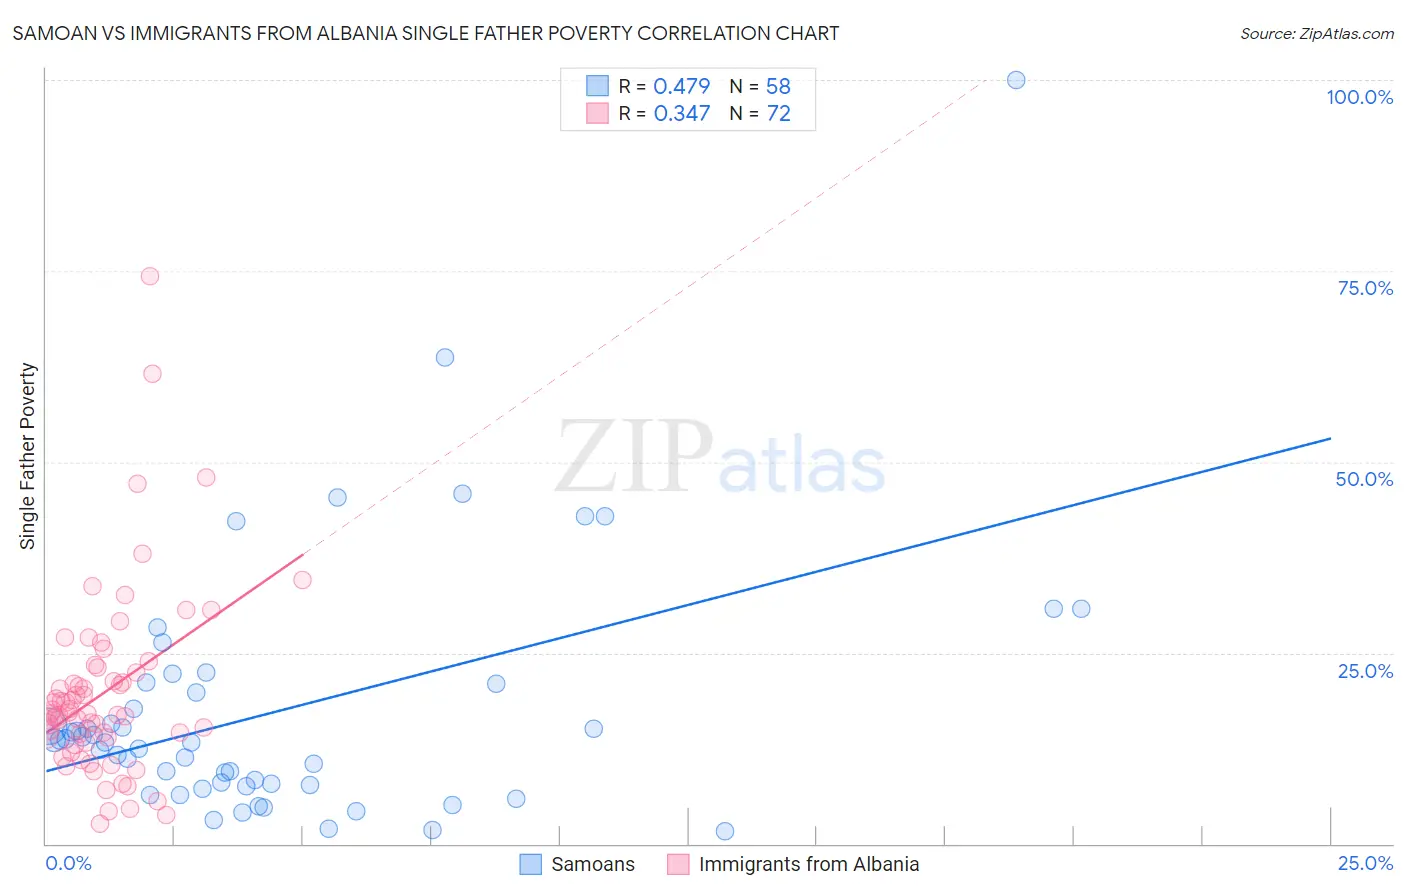
Samoan vs Immigrants from Albania Single Father Poverty Correlation Chart
The statistical analysis conducted on geographies consisting of 195,405,703 people shows a moderate positive correlation between the proportion of Samoans and poverty level among single fathers in the United States with a correlation coefficient (R) of 0.479 and weighted average of 13.8%. Similarly, the statistical analysis conducted on geographies consisting of 101,642,932 people shows a mild positive correlation between the proportion of Immigrants from Albania and poverty level among single fathers in the United States with a correlation coefficient (R) of 0.347 and weighted average of 17.2%, a difference of 24.5%.
Single Father Poverty Correlation Summary
| Measurement | Samoan | Immigrants from Albania |
| Minimum | 1.7% | 2.6% |
| Maximum | 100.0% | 74.4% |
| Range | 98.3% | 71.7% |
| Mean | 17.6% | 19.8% |
| Median | 13.4% | 17.1% |
| Interquartile 25% (IQ1) | 7.7% | 13.5% |
| Interquartile 75% (IQ3) | 20.9% | 22.7% |
| Interquartile Range (IQR) | 13.2% | 9.2% |
| Standard Deviation (Sample) | 16.9% | 12.2% |
| Standard Deviation (Population) | 16.8% | 12.1% |
Similar Demographics by Single Father Poverty
Demographics Similar to Samoans by Single Father Poverty
In terms of single father poverty, the demographic groups most similar to Samoans are Immigrants from Taiwan (13.7%, a difference of 0.86%), Afghan (14.0%, a difference of 1.1%), Korean (14.0%, a difference of 1.2%), Filipino (14.0%, a difference of 1.6%), and Immigrants from India (14.0%, a difference of 1.6%).
| Demographics | Rating | Rank | Single Father Poverty |
| Assyrians/Chaldeans/Syriacs | 100.0 /100 | #1 | Exceptional 11.7% |
| Tongans | 100.0 /100 | #2 | Exceptional 12.2% |
| Tsimshian | 100.0 /100 | #3 | Exceptional 12.7% |
| Immigrants | Fiji | 100.0 /100 | #4 | Exceptional 13.2% |
| Immigrants | Ethiopia | 100.0 /100 | #5 | Exceptional 13.4% |
| Ethiopians | 100.0 /100 | #6 | Exceptional 13.5% |
| Immigrants | Taiwan | 100.0 /100 | #7 | Exceptional 13.7% |
| Samoans | 100.0 /100 | #8 | Exceptional 13.8% |
| Afghans | 100.0 /100 | #9 | Exceptional 14.0% |
| Koreans | 100.0 /100 | #10 | Exceptional 14.0% |
| Filipinos | 100.0 /100 | #11 | Exceptional 14.0% |
| Immigrants | India | 100.0 /100 | #12 | Exceptional 14.0% |
| Immigrants | Philippines | 100.0 /100 | #13 | Exceptional 14.0% |
| Immigrants | Vietnam | 100.0 /100 | #14 | Exceptional 14.1% |
| Sri Lankans | 100.0 /100 | #15 | Exceptional 14.2% |
Demographics Similar to Immigrants from Albania by Single Father Poverty
In terms of single father poverty, the demographic groups most similar to Immigrants from Albania are Albanian (17.2%, a difference of 0.020%), Immigrants from Jamaica (17.2%, a difference of 0.050%), Immigrants from Haiti (17.2%, a difference of 0.080%), Sierra Leonean (17.2%, a difference of 0.090%), and Spaniard (17.2%, a difference of 0.20%).
| Demographics | Rating | Rank | Single Father Poverty |
| Austrians | 1.1 /100 | #250 | Tragic 17.1% |
| Luxembourgers | 1.1 /100 | #251 | Tragic 17.1% |
| Croatians | 1.0 /100 | #252 | Tragic 17.1% |
| Cree | 1.0 /100 | #253 | Tragic 17.1% |
| Immigrants | Honduras | 0.9 /100 | #254 | Tragic 17.1% |
| Sierra Leoneans | 0.8 /100 | #255 | Tragic 17.2% |
| Immigrants | Haiti | 0.8 /100 | #256 | Tragic 17.2% |
| Immigrants | Albania | 0.7 /100 | #257 | Tragic 17.2% |
| Albanians | 0.7 /100 | #258 | Tragic 17.2% |
| Immigrants | Jamaica | 0.7 /100 | #259 | Tragic 17.2% |
| Spaniards | 0.6 /100 | #260 | Tragic 17.2% |
| Swiss | 0.5 /100 | #261 | Tragic 17.3% |
| Immigrants | Zaire | 0.4 /100 | #262 | Tragic 17.3% |
| Lithuanians | 0.4 /100 | #263 | Tragic 17.3% |
| Slovenes | 0.3 /100 | #264 | Tragic 17.3% |