Chippewa vs Colville Child Poverty Among Boys Under 16
COMPARE
Chippewa
Colville
Child Poverty Among Boys Under 16
Child Poverty Among Boys Under 16 Comparison
Chippewa
Colville
21.0%
CHILD POVERTY AMONG BOYS UNDER 16
0.0/ 100
METRIC RATING
298th/ 347
METRIC RANK
24.1%
CHILD POVERTY AMONG BOYS UNDER 16
0.0/ 100
METRIC RATING
330th/ 347
METRIC RANK
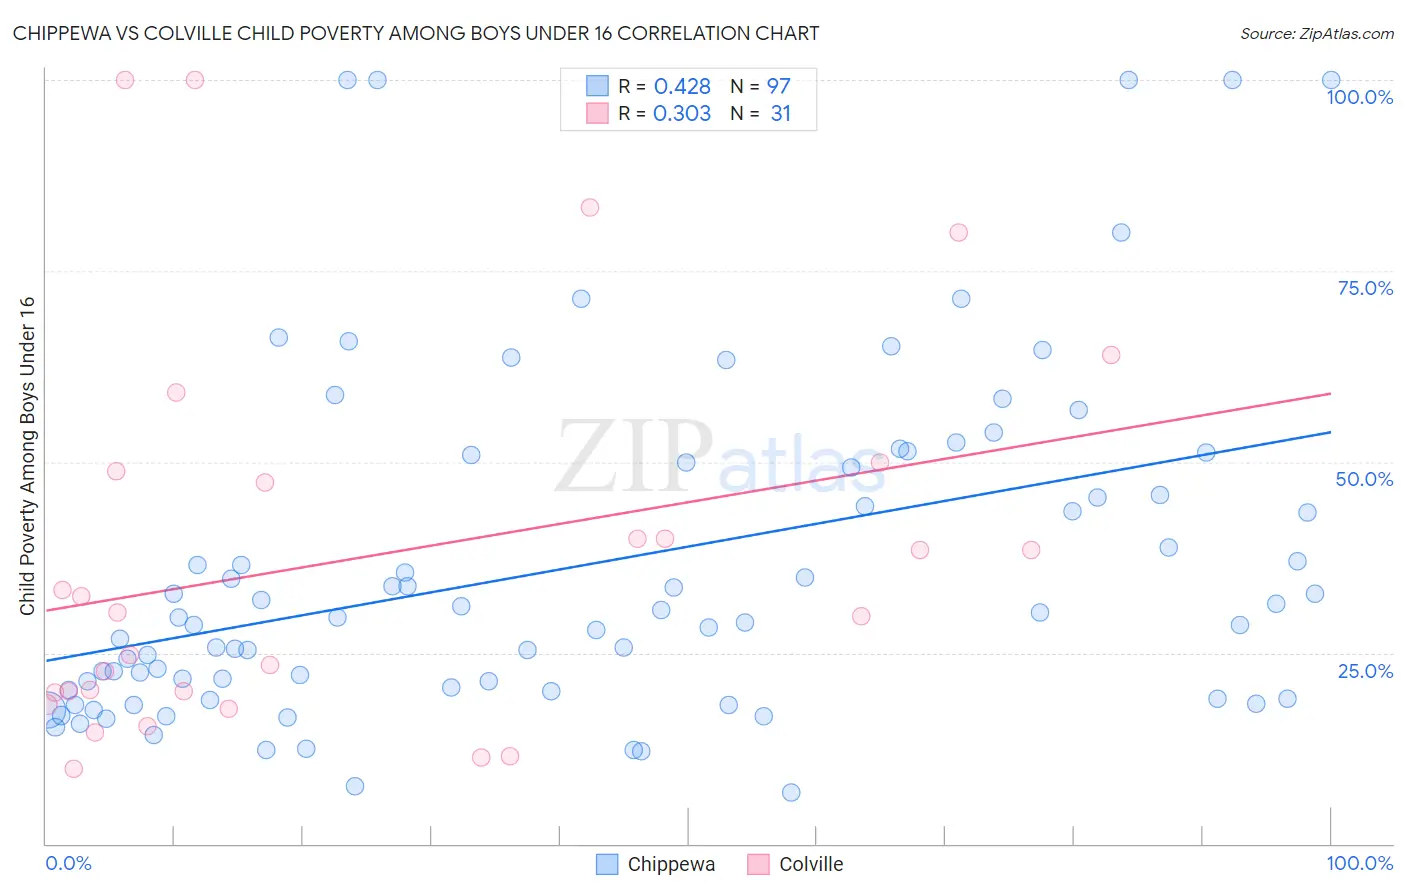
Chippewa vs Colville Child Poverty Among Boys Under 16 Correlation Chart
The statistical analysis conducted on geographies consisting of 213,098,717 people shows a moderate positive correlation between the proportion of Chippewa and poverty level among boys under the age of 16 in the United States with a correlation coefficient (R) of 0.428 and weighted average of 21.0%. Similarly, the statistical analysis conducted on geographies consisting of 34,562,451 people shows a mild positive correlation between the proportion of Colville and poverty level among boys under the age of 16 in the United States with a correlation coefficient (R) of 0.303 and weighted average of 24.1%, a difference of 14.9%.
Child Poverty Among Boys Under 16 Correlation Summary
| Measurement | Chippewa | Colville |
| Minimum | 6.7% | 9.8% |
| Maximum | 100.0% | 100.0% |
| Range | 93.3% | 90.2% |
| Mean | 36.2% | 37.5% |
| Median | 29.7% | 30.4% |
| Interquartile 25% (IQ1) | 20.1% | 19.7% |
| Interquartile 75% (IQ3) | 49.6% | 48.8% |
| Interquartile Range (IQR) | 29.5% | 29.1% |
| Standard Deviation (Sample) | 22.2% | 25.3% |
| Standard Deviation (Population) | 22.1% | 24.9% |
Similar Demographics by Child Poverty Among Boys Under 16
Demographics Similar to Chippewa by Child Poverty Among Boys Under 16
In terms of child poverty among boys under 16, the demographic groups most similar to Chippewa are Hispanic or Latino (20.9%, a difference of 0.26%), Immigrants from Caribbean (21.0%, a difference of 0.27%), Haitian (21.0%, a difference of 0.32%), Indonesian (20.8%, a difference of 0.86%), and Guatemalan (21.1%, a difference of 0.86%).
| Demographics | Rating | Rank | Child Poverty Among Boys Under 16 |
| Immigrants | Latin America | 0.0 /100 | #291 | Tragic 20.6% |
| Yaqui | 0.0 /100 | #292 | Tragic 20.7% |
| Immigrants | Senegal | 0.0 /100 | #293 | Tragic 20.7% |
| Immigrants | Bahamas | 0.0 /100 | #294 | Tragic 20.7% |
| Mexicans | 0.0 /100 | #295 | Tragic 20.7% |
| Indonesians | 0.0 /100 | #296 | Tragic 20.8% |
| Hispanics or Latinos | 0.0 /100 | #297 | Tragic 20.9% |
| Chippewa | 0.0 /100 | #298 | Tragic 21.0% |
| Immigrants | Caribbean | 0.0 /100 | #299 | Tragic 21.0% |
| Haitians | 0.0 /100 | #300 | Tragic 21.0% |
| Guatemalans | 0.0 /100 | #301 | Tragic 21.1% |
| Somalis | 0.0 /100 | #302 | Tragic 21.1% |
| Immigrants | Haiti | 0.0 /100 | #303 | Tragic 21.3% |
| Immigrants | Central America | 0.0 /100 | #304 | Tragic 21.3% |
| Kiowa | 0.0 /100 | #305 | Tragic 21.3% |
Demographics Similar to Colville by Child Poverty Among Boys Under 16
In terms of child poverty among boys under 16, the demographic groups most similar to Colville are Dominican (24.2%, a difference of 0.34%), Native/Alaskan (24.0%, a difference of 0.58%), Immigrants from Dominican Republic (24.3%, a difference of 0.93%), Apache (24.5%, a difference of 1.7%), and Black/African American (24.5%, a difference of 1.8%).
| Demographics | Rating | Rank | Child Poverty Among Boys Under 16 |
| Hondurans | 0.0 /100 | #323 | Tragic 22.3% |
| Immigrants | Congo | 0.0 /100 | #324 | Tragic 22.4% |
| Central American Indians | 0.0 /100 | #325 | Tragic 22.5% |
| Paiute | 0.0 /100 | #326 | Tragic 22.8% |
| Immigrants | Honduras | 0.0 /100 | #327 | Tragic 22.8% |
| Pueblo | 0.0 /100 | #328 | Tragic 23.5% |
| Natives/Alaskans | 0.0 /100 | #329 | Tragic 24.0% |
| Colville | 0.0 /100 | #330 | Tragic 24.1% |
| Dominicans | 0.0 /100 | #331 | Tragic 24.2% |
| Immigrants | Dominican Republic | 0.0 /100 | #332 | Tragic 24.3% |
| Apache | 0.0 /100 | #333 | Tragic 24.5% |
| Blacks/African Americans | 0.0 /100 | #334 | Tragic 24.5% |
| Yup'ik | 0.0 /100 | #335 | Tragic 24.7% |
| Sioux | 0.0 /100 | #336 | Tragic 25.3% |
| Cheyenne | 0.0 /100 | #337 | Tragic 25.8% |