Immigrants from Nicaragua vs Colville Child Poverty Among Boys Under 16

COMPARE

Immigrants from Nicaragua
Race
Ancestry
AfghanAfricanAlaska NativeAlaskan AthabascanAlbanianAleutAlsatianAmericanApacheArabArapahoArgentineanArmenianAssyrian/Chaldean/SyriacAustralianAustrianBahamianBangladeshiBarbadianBasqueBelgianBelizeanBermudanBhutaneseBlackfeetBolivianBrazilianBritishBritish West IndianBulgarianBurmeseCajunCambodianCanadianCape VerdeanCarpatho RusynCelticCentral AmericanCentral American IndianCherokeeCheyenneChickasawChileanChineseChippewaChoctawColombianComancheCosta RicanCreeCreekCroatianCrowCubanCypriotCzechCzechoslovakianDanishDelawareDominicanDutchDutch West IndianEastern EuropeanEcuadorianEgyptianEnglishEstonianEthiopianEuropeanFijianFilipinoFinnishFrenchFrench American IndianFrench CanadianGermanGerman RussianGhanaianGreekGuamanian/ChamorroGuatemalanGuyaneseHaitianHmongHonduranHopiHoumaHungarianIcelanderIndian (Asian)IndonesianInupiatIranianIraqiIrishIroquoisIsraeliItalianJamaicanJapaneseJordanianKenyanKiowaKoreanLaotianLatvianLebaneseLiberianLithuanianLumbeeLuxembourgerMacedonianMalaysianMalteseMarshalleseMenomineeMexicanMexican American IndianMongolianMoroccanNative HawaiianNavajoNepaleseNew ZealanderNicaraguanNigerianNorthern EuropeanNorwegianOkinawanOsageOttawaPaiutePakistaniPalestinianPanamanianParaguayanPennsylvania GermanPeruvianPimaPolishPortuguesePotawatomiPuebloPuerto RicanPuget Sound SalishRomanianRussianSalvadoranSamoanScandinavianScotch-IrishScottishSeminoleSenegaleseSerbianShoshoneSierra LeoneanSiouxSlavicSlovakSloveneSomaliSouth AfricanSouth AmericanSouth American IndianSoviet UnionSpaniardSpanishSpanish AmericanSpanish American IndianSri LankanSubsaharan AfricanSudaneseSwedishSwissSyrianTaiwaneseThaiTlingit-HaidaTohono O'OdhamTonganTrinidadian and TobagonianTsimshianTurkishU.S. Virgin IslanderUgandanUkrainianUruguayanUteVenezuelanVietnameseWelshWest IndianYakamaYaquiYugoslavianYumanYup'ikZimbabwean
Immigration
NonimmigrantsImmigrantsAfghanistanAfricaAlbaniaArgentinaArmeniaAsiaAustraliaAustriaBahamasBangladeshBarbadosBelarusBelgiumBelizeBoliviaBosnia and HerzegovinaBrazilBulgariaBurma/MyanmarCabo VerdeCambodiaCameroonCanadaCaribbeanCentral AmericaChileChinaColombiaCongoCosta RicaCroatiaCubaCzechoslovakiaDenmarkDominicaDominican RepublicEastern AfricaEastern AsiaEastern EuropeEcuadorEgyptEl SalvadorEnglandEritreaEthiopiaEuropeFijiFranceGermanyGhanaGreeceGrenadaGuatemalaGuyanaHaitiHondurasHong KongHungaryIndiaIndonesiaIranIraqIrelandIsraelItalyJamaicaJapanJordanKazakhstanKenyaKoreaKuwaitLaosLatin AmericaLatviaLebanonLiberiaLithuaniaMalaysiaMexicoMicronesiaMiddle AfricaMoldovaMoroccoNepalNetherlandsNicaraguaNigeriaNorth AmericaNorth MacedoniaNorthern AfricaNorthern EuropeNorwayOceaniaPakistanPanamaPeruPhilippinesPolandPortugalRomaniaRussiaSaudi ArabiaScotlandSenegalSerbiaSierra LeoneSingaporeSomaliaSouth AfricaSouth AmericaSouth Central AsiaSouth Eastern AsiaSouthern EuropeSpainSri LankaSt. Vincent and the GrenadinesSudanSwedenSwitzerlandSyriaTaiwanThailandTrinidad and TobagoTurkeyUgandaUkraineUruguayUzbekistanVenezuelaVietnamWest IndiesWestern AfricaWestern AsiaWestern EuropeYemenZaireZimbabweAzores
Colville
Race
Ancestry
AfghanAfricanAlaska NativeAlaskan AthabascanAlbanianAleutAlsatianAmericanApacheArabArapahoArgentineanArmenianAssyrian/Chaldean/SyriacAustralianAustrianBahamianBangladeshiBarbadianBasqueBelgianBelizeanBermudanBhutaneseBlackfeetBolivianBrazilianBritishBritish West IndianBulgarianBurmeseCajunCambodianCanadianCape VerdeanCarpatho RusynCelticCentral AmericanCentral American IndianCherokeeCheyenneChickasawChileanChineseChippewaChoctawColombianColvilleComancheCosta RicanCreeCreekCroatianCrowCubanCypriotCzechCzechoslovakianDanishDelawareDominicanDutchDutch West IndianEastern EuropeanEcuadorianEgyptianEnglishEstonianEthiopianEuropeanFijianFilipinoFinnishFrenchFrench American IndianFrench CanadianGermanGerman RussianGhanaianGreekGuamanian/ChamorroGuatemalanGuyaneseHaitianHmongHonduranHopiHoumaHungarianIcelanderIndian (Asian)IndonesianInupiatIranianIraqiIrishIroquoisIsraeliItalianJamaicanJapaneseJordanianKenyanKiowaKoreanLaotianLatvianLebaneseLiberianLithuanianLumbeeLuxembourgerMacedonianMalaysianMalteseMarshalleseMenomineeMexicanMexican American IndianMongolianMoroccanNative HawaiianNavajoNepaleseNew ZealanderNicaraguanNigerianNorthern EuropeanNorwegianOkinawanOsageOttawaPaiutePakistaniPalestinianPanamanianParaguayanPennsylvania GermanPeruvianPimaPolishPortuguesePotawatomiPuebloPuerto RicanPuget Sound SalishRomanianRussianSalvadoranSamoanScandinavianScotch-IrishScottishSeminoleSenegaleseSerbianShoshoneSierra LeoneanSiouxSlavicSlovakSloveneSomaliSouth AfricanSouth AmericanSouth American IndianSoviet UnionSpaniardSpanishSpanish AmericanSpanish American IndianSri LankanSubsaharan AfricanSudaneseSwedishSwissSyrianTaiwaneseThaiTlingit-HaidaTohono O'OdhamTonganTrinidadian and TobagonianTsimshianTurkishU.S. Virgin IslanderUgandanUkrainianUruguayanUteVenezuelanVietnameseWelshWest IndianYakamaYaquiYugoslavianYumanYup'ikZimbabwean
Immigration
NonimmigrantsImmigrantsAfghanistanAfricaAlbaniaArgentinaArmeniaAsiaAustraliaAustriaBahamasBangladeshBarbadosBelarusBelgiumBelizeBoliviaBosnia and HerzegovinaBrazilBulgariaBurma/MyanmarCabo VerdeCambodiaCameroonCanadaCaribbeanCentral AmericaChileChinaColombiaCongoCosta RicaCroatiaCubaCzechoslovakiaDenmarkDominicaDominican RepublicEastern AfricaEastern AsiaEastern EuropeEcuadorEgyptEl SalvadorEnglandEritreaEthiopiaEuropeFijiFranceGermanyGhanaGreeceGrenadaGuatemalaGuyanaHaitiHondurasHong KongHungaryIndiaIndonesiaIranIraqIrelandIsraelItalyJamaicaJapanJordanKazakhstanKenyaKoreaKuwaitLaosLatin AmericaLatviaLebanonLiberiaLithuaniaMalaysiaMexicoMicronesiaMiddle AfricaMoldovaMoroccoNepalNetherlandsNigeriaNorth AmericaNorth MacedoniaNorthern AfricaNorthern EuropeNorwayOceaniaPakistanPanamaPeruPhilippinesPolandPortugalRomaniaRussiaSaudi ArabiaScotlandSenegalSerbiaSierra LeoneSingaporeSomaliaSouth AfricaSouth AmericaSouth Central AsiaSouth Eastern AsiaSouthern EuropeSpainSri LankaSt. Vincent and the GrenadinesSudanSwedenSwitzerlandSyriaTaiwanThailandTrinidad and TobagoTurkeyUgandaUkraineUruguayUzbekistanVenezuelaVietnamWest IndiesWestern AfricaWestern AsiaWestern EuropeYemenZaireZimbabweAzores
Child Poverty Among Boys Under 16
Income
Poverty
Unemployment
Labor Participation
Family Structure
Vehicle Availability
Education Level
Disability

Child Poverty Among Boys Under 16 Comparison

Immigrants from Nicaragua

Colville

Tragic
Tragic
19.0%
CHILD POVERTY AMONG BOYS UNDER 16
0.4/ 100
METRIC RATING
246th/ 347
METRIC RANK
24.1%
CHILD POVERTY AMONG BOYS UNDER 16
0.0/ 100
METRIC RATING
330th/ 347
METRIC RANK

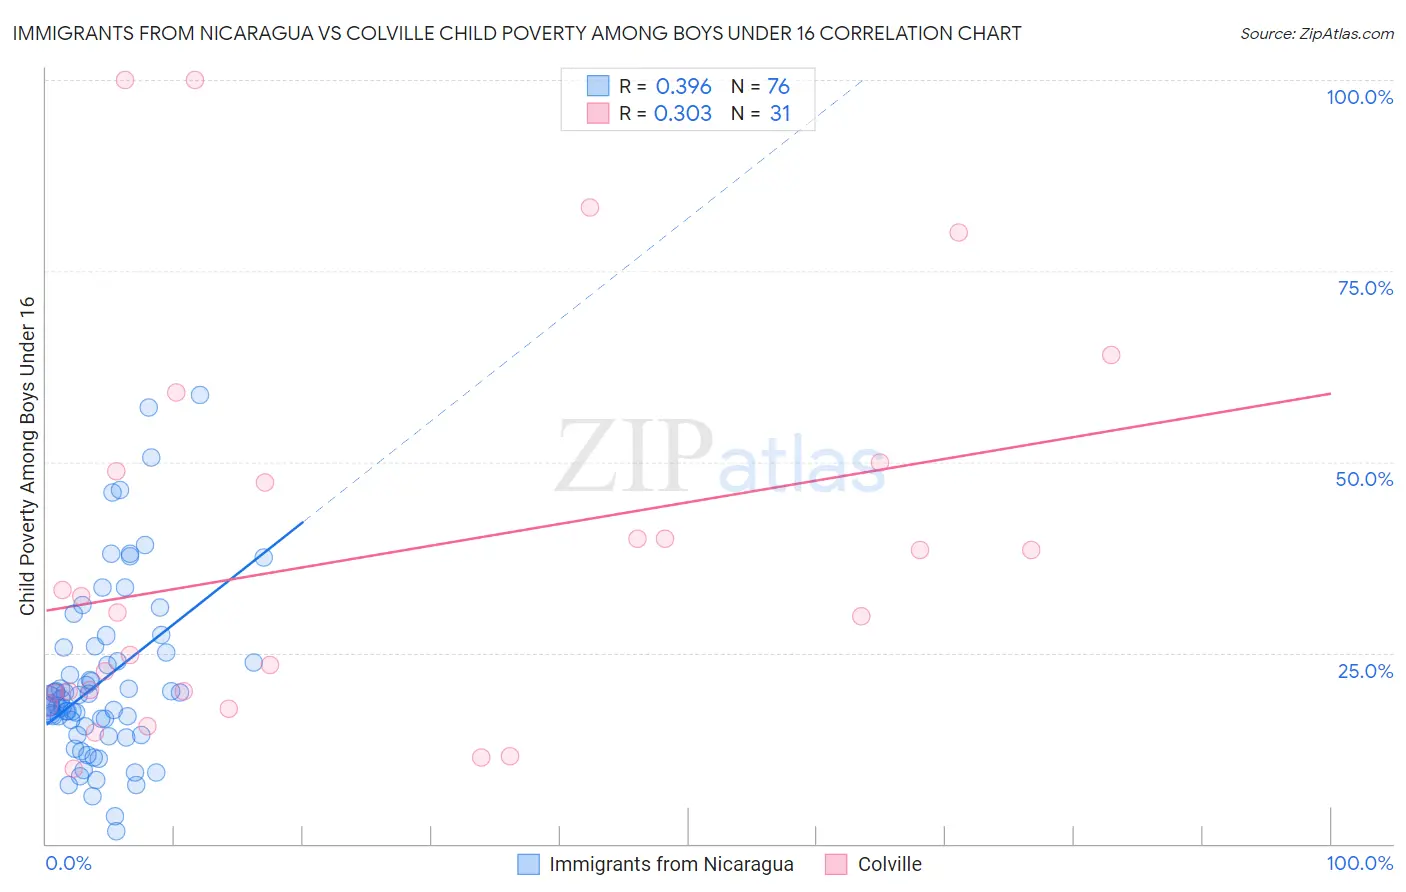
Immigrants from Nicaragua vs Colville Child Poverty Among Boys Under 16 Correlation Chart

The statistical analysis conducted on geographies consisting of 235,106,184 people shows a mild positive correlation between the proportion of Immigrants from Nicaragua and poverty level among boys under the age of 16 in the United States with a correlation coefficient (R) of 0.396 and weighted average of 19.0%. Similarly, the statistical analysis conducted on geographies consisting of 34,562,451 people shows a mild positive correlation between the proportion of Colville and poverty level among boys under the age of 16 in the United States with a correlation coefficient (R) of 0.303 and weighted average of 24.1%, a difference of 26.8%.
Immigrants from Nicaragua vs Colville Child Poverty Among Boys Under 16

Child Poverty Among Boys Under 16 Correlation Summary

MeasurementImmigrants from NicaraguaColville
Minimum1.7%9.8%
Maximum58.8%100.0%
Range57.0%90.2%
Mean21.4%37.5%
Median18.6%30.4%
Interquartile 25% (IQ1)14.9%19.7%
Interquartile 75% (IQ3)25.4%48.8%
Interquartile Range (IQR)10.5%29.1%
Standard Deviation (Sample)11.5%25.3%
Standard Deviation (Population)11.4%24.9%

Similar Demographics by Child Poverty Among Boys Under 16

Demographics Similar to Immigrants from Nicaragua by Child Poverty Among Boys Under 16

In terms of child poverty among boys under 16, the demographic groups most similar to Immigrants from Nicaragua are Immigrants from Trinidad and Tobago (19.0%, a difference of 0.12%), Cree (19.0%, a difference of 0.20%), Salvadoran (19.0%, a difference of 0.20%), Immigrants from Middle Africa (18.9%, a difference of 0.33%), and Immigrants from the Azores (18.9%, a difference of 0.34%).
DemographicsRating | RankChild Poverty Among Boys Under 16
Cape Verdeans
0.7
/100
|
#239
Tragic
18.7%
Immigrants | Cuba
0.6
/100
|
#240
Tragic
18.8%
Immigrants | Sudan
0.6
/100
|
#241
Tragic
18.8%
Ghanaians
0.5
/100
|
#242
Tragic
18.9%
Immigrants | Azores
0.4
/100
|
#243
Tragic
18.9%
Immigrants | Middle Africa
0.4
/100
|
#244
Tragic
18.9%
Cree
0.4
/100
|
#245
Tragic
19.0%
Immigrants | Nicaragua
0.4
/100
|
#246
Tragic
19.0%
Immigrants | Trinidad and Tobago
0.3
/100
|
#247
Tragic
19.0%
Salvadorans
0.3
/100
|
#248
Tragic
19.0%
Alsatians
0.3
/100
|
#249
Tragic
19.1%
Immigrants | Burma/Myanmar
0.2
/100
|
#250
Tragic
19.2%
French American Indians
0.2
/100
|
#251
Tragic
19.2%
Immigrants | Western Africa
0.2
/100
|
#252
Tragic
19.3%
Liberians
0.2
/100
|
#253
Tragic
19.3%

Demographics Similar to Colville by Child Poverty Among Boys Under 16

In terms of child poverty among boys under 16, the demographic groups most similar to Colville are Dominican (24.2%, a difference of 0.34%), Native/Alaskan (24.0%, a difference of 0.58%), Immigrants from Dominican Republic (24.3%, a difference of 0.93%), Apache (24.5%, a difference of 1.7%), and Black/African American (24.5%, a difference of 1.8%).
DemographicsRating | RankChild Poverty Among Boys Under 16
Hondurans
0.0
/100
|
#323
Tragic
22.3%
Immigrants | Congo
0.0
/100
|
#324
Tragic
22.4%
Central American Indians
0.0
/100
|
#325
Tragic
22.5%
Paiute
0.0
/100
|
#326
Tragic
22.8%
Immigrants | Honduras
0.0
/100
|
#327
Tragic
22.8%
Pueblo
0.0
/100
|
#328
Tragic
23.5%
Natives/Alaskans
0.0
/100
|
#329
Tragic
24.0%
Colville
0.0
/100
|
#330
Tragic
24.1%
Dominicans
0.0
/100
|
#331
Tragic
24.2%
Immigrants | Dominican Republic
0.0
/100
|
#332
Tragic
24.3%
Apache
0.0
/100
|
#333
Tragic
24.5%
Blacks/African Americans
0.0
/100
|
#334
Tragic
24.5%
Yup'ik
0.0
/100
|
#335
Tragic
24.7%
Sioux
0.0
/100
|
#336
Tragic
25.3%
Cheyenne
0.0
/100
|
#337
Tragic
25.8%